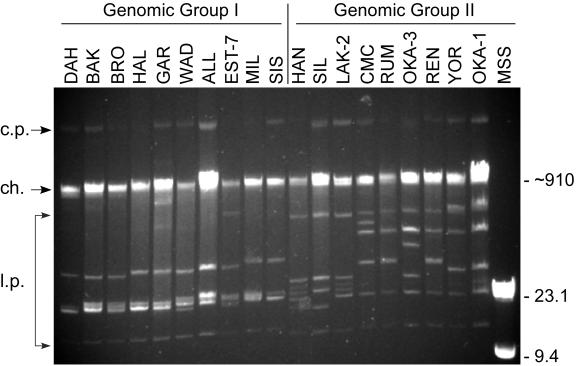
FIG. 1.
Plasmid profiles of representative isolates of B. hermsii demonstrating patterns associated with the two genomic groups based on DNA sequence analysis (see subsequent figures). Isolate designations are shown above each lane, and DNA size estimates are shown on the right in kilobases. Arrows on the left show the positions of the circular plasmids (c.p.), chromosome (ch.), and various-sized linear plasmids (l.p.).

