FIG. 1.
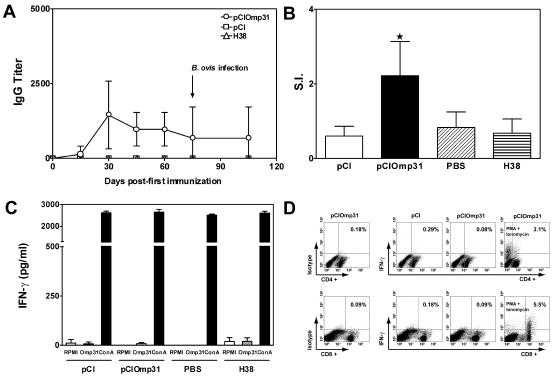
A. Kinetics of the humoral response elicited after immunization with the Omp31 DNA vaccine. Mice were immunized with pCIOmp31, pCI, or H38 and bled retro-orbitally at the indicated days. IgG-specific antibodies against rOmp31 were evaluated by ELISA. Each symbol represents the mean ± SD for eight animals. The arrow indicates the time of B. ovis infection. B. Proliferative responses of spleen cells from mice immunized with pCIOmp31. Cells from immunized mice (2 × 10⁵ cells/well) were stimulated with rOmp31 (1 μg/ml) for 5 days, and incorporation of [3H] thymidine was measured. The S.I. corresponds to the counts per minute of stimulated cells divided by counts per minute of unstimulated cells. Results are expressed as the mean ± SD for five mice. ★, significantly different from PBS-immunized group (P < 0.05). Data are representative of three separate experiments. C. Determination of IFN-γ production in cells from pCI-, pCIOmp31-, PBS-, or H38-immunized mice. Spleen cells (4 × 10⁶/ml) from mice were stimulated with RPMI, rOmp31 (1 μg/ml), or ConA (2.5 μg/ml) for 48 h. IFN-γ in cell supernatants was quantified by antibody capture ELISA. Each value represents the mean ± SD of the responses of spleen cells from five individual mice. Data are representative of four separate experiments. D. Expression of IFN-γ versus cell surface markers in spleen cells from pCI- or pCIOmp31-immunized mice. Spleen cells from pCI- or pCIOmp31-immunized mice were cultured for 5 days with mitomycin C-treated A20JOmp31. On day 5 they were restimulated with mitomycin C-treated A20JOmp31 cells and rOmp31 (10 μg/ml) or, where indicated, with phorbol myristate acetate (20 ng/ml) plus ionomycin (750 ng/ml) and then incubated for 4 h with 10 μg/ml of BFA before analysis by flow cytometry. Numbers within quadrants represent the percentage of positive gated cells.

