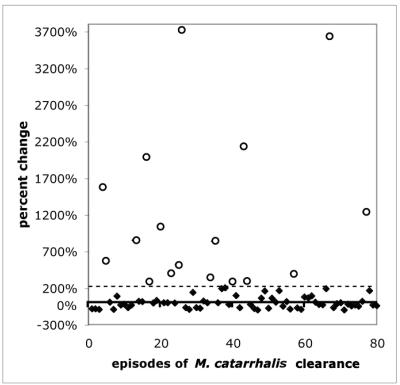
FIG. 4.
Results of sputum supernatant IgA ELISAs for 80 episodes of carriage of M. catarrhalis. The y axis is the percent change in OD between the preacquisition and postclearance samples. The dotted line indicates the cutoff (223.1%) for a significant percent change in sputum supernatant IgA. The 17 open circles are the samples that showed a significant increase in sputum supernatant IgA from preacquisition to postclearance samples. The solid diamonds indicate the samples that did not show a significant increase in IgA to OMP G1a.

