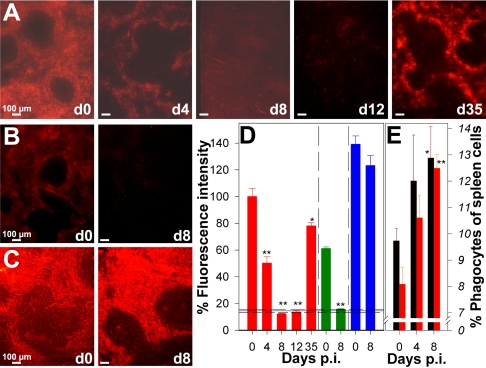
FIG. 2.
(A to C) Trapping capacity of the spleen during P. chabaudi infection. Splenic uptake of pRBC (A), RBC (B), and BSA-TRITC (C) was analyzed by fluorescence microscopy on the days indicated (d0 to d35) after injection of 1 × 10⁹ PKH-26-labeled pRBC or noninfected RBC or 500 μg BSA-TRITC. (D) Semiquantitative evaluation of fluorescence intensity for 10 cryosections per mouse with three to five mice per time after injection of PKH-26-labeled pRBC (red bars), noninfected RBC (green bars), and BSA-TRITC (blue bars). Each bar indicates the mean, and each error bar indicates 0.5 standard error of the mean. The horizontal lines indicate means ± standard errors of the means for background fluorescence for cryosections of mice that did not receive an injection. (E) Numbers of F4/80+ macrophages (black bars) and Gr-1+ granulocytes (red bars) expressed as percentages of the total spleen cells. Each bar indicates the mean, and each error bar indicates 0.5 standard error of the mean. One asterisk, P < 0.05 compared with day 0 p.i.; two asterisks, P < 0.01 compared with day 0 p.i.

