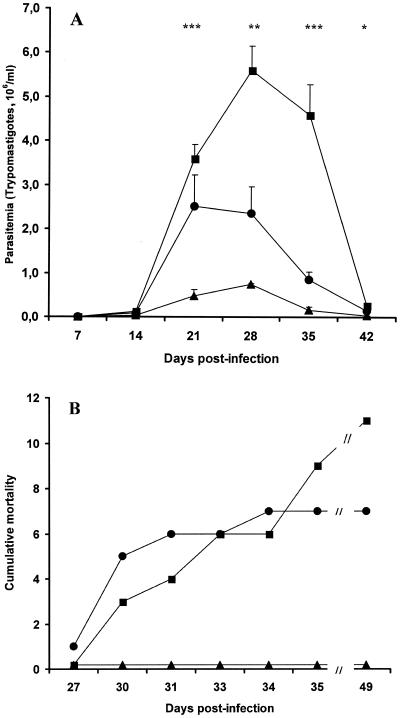
FIG. 2.
Parasitemia and cumulative mortality of mice infected with the Y, YpTEX, and YpTEX-CD40L strains. (A) Three groups (38 mice per group) were infected on day 0 with the Y (▪), YpTEX (•), or YpTEX-CD40L (▴) strain. Parasitemia was recorded every week. The data are means ± standard errors of the means of two independent experiments in which 15 and 23 mice per group were used. Because some mice died in the course of infection or were sacrificed to harvest the spleens, 36, 30, 28, 26, 20, and 10 mice were in the group infected with strain Y on days 7, 14, 21, 28, 35, and 42 postinfection, respectively; 36, 30, 28, 26, 18, and 15 mice were in the group infected with YpTEX on days 7, 14, 21, 28, 35, and 42 postinfection, respectively; and 36, 30, 28, 26, 24, and 22 mice were in the group infected with YpTEX-CD40L on days 7, 14, 21, 28, 35, and 42 postinfection, respectively. For comparisons of YpTEX-CD40L and YpTEX, one asterisk indicates that the P value is <0.05, two asterisks indicate that the P value is <0.01, and three asterisks indicate that the P value is <0.001 (as determined by the Mann-Whitney U test). (B) Three groups (38 mice per group) were infected on day 0 with the Y (▪), YpTEX (•), or YpTEX-CD40L (▴) strain. The number of surviving mice was recorded every day. Sacrificed mice were excluded from calculation of the survival rate. The data are from two independent experiments. The results are expressed as the number of mice that died (cumulative mortality) during the course of infection. For YpTEX-CD40L versus Y, P = 0.0002; for YpTEX-CD40L versus YpTEX, P = 0.004; for YpTEX versus Y, P = 0.62 (not significant) (as determined by Gehan's Wilcoxon test).

