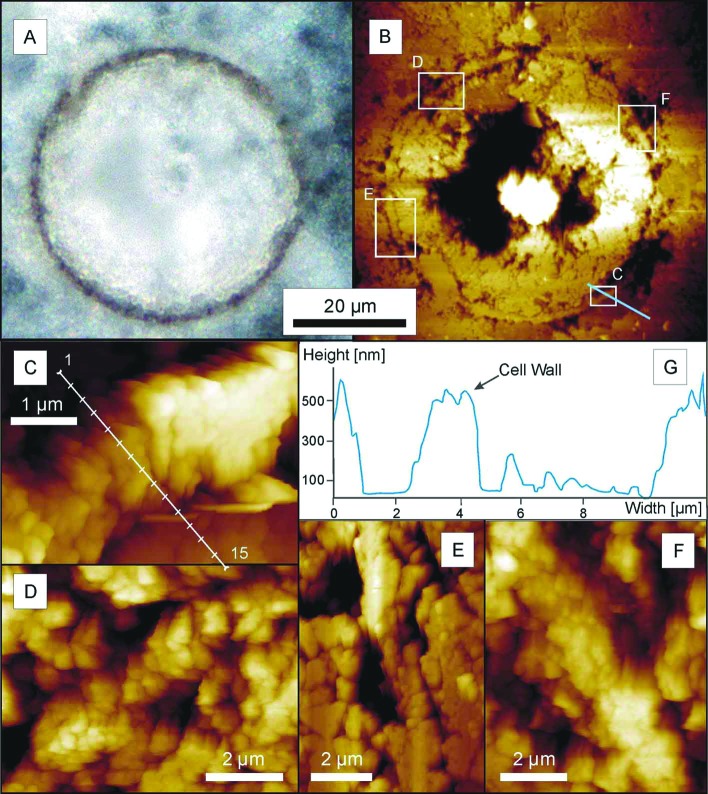
Figure 2.
Petrified Chichkan sphaeromorph. (A) Digital photograph of the equatorial plane of the specimen in reflected light, before AFM analysis. (B) AFM image showing the part of the specimen analyzed and, denoted by the white rectangles, the areas for which higher magnification micrographs are shown (C–F); the irregular black areas are cavities within and adjacent to the cell wall, produced by acid etching; the blue line crossing rectangle C shows the transect through the cell wall along which topography was measured (G). (C–F) Atomic force micrographs showing the substructure of the representative portions of the cell wall shown in the corresponding rectangles in B; the white line in C denotes the transect (locations 1–15, from outside the spheroid to beyond its inner surface) where the adhesion measurements plotted in Fig. 5 were obtained. (G) A topographic transect through a portion of the cell wall, measured from inside the spheroid (Left) to beyond its outer surface (Right) along the blue line that in B crosses rectangle C, demonstrating the characteristic preferential etching of the matrix adjacent to both the inner and outer surfaces of the wall.

