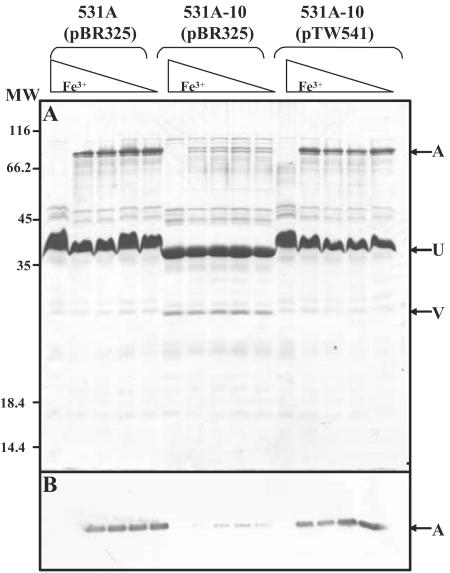
FIG. 5.
FatA protein levels in mutant strain 531A-10. (A) Coomassie blue R-stained SDS-PAGE of OM preparations from indicated strains. (B) FatA levels measured by Western PAGE analysis of OM preparations shown in panel A and as described in Materials and Methods. Each strain was grown in CM9 supplemented with either 10 μg/ml ferric ammonium citrate (iron-sufficient conditions) or increasing concentrations of EDDA (iron-deficient conditions). EDDA concentrations in iron-restricted cultures ranged from 5 to 40 μM, increasing in twofold increments. Locations of FatA (A), OmpU (U), and OmpV (V) are denoted with arrows and were verified by protein microsequencing. MW, molecular weight (103).

