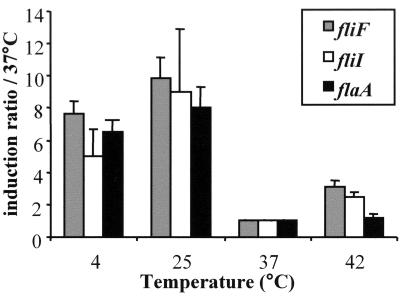
FIG. 2.
Transcriptional analysis of the expression of flaA, fliF, and fliI at different temperatures. Gene expression was measured by real-time PCR from bacteria in exponential phase of growth (in BHI broth). The amount of each gene mRNA was normalized by the amount of gyr mRNA (constant under these conditions). Induction ratios were then compared to the 37°C condition. Values shown are means of results from at least three assays for different mRNA preparations for each temperature. Error bars indicate the standard deviations.

