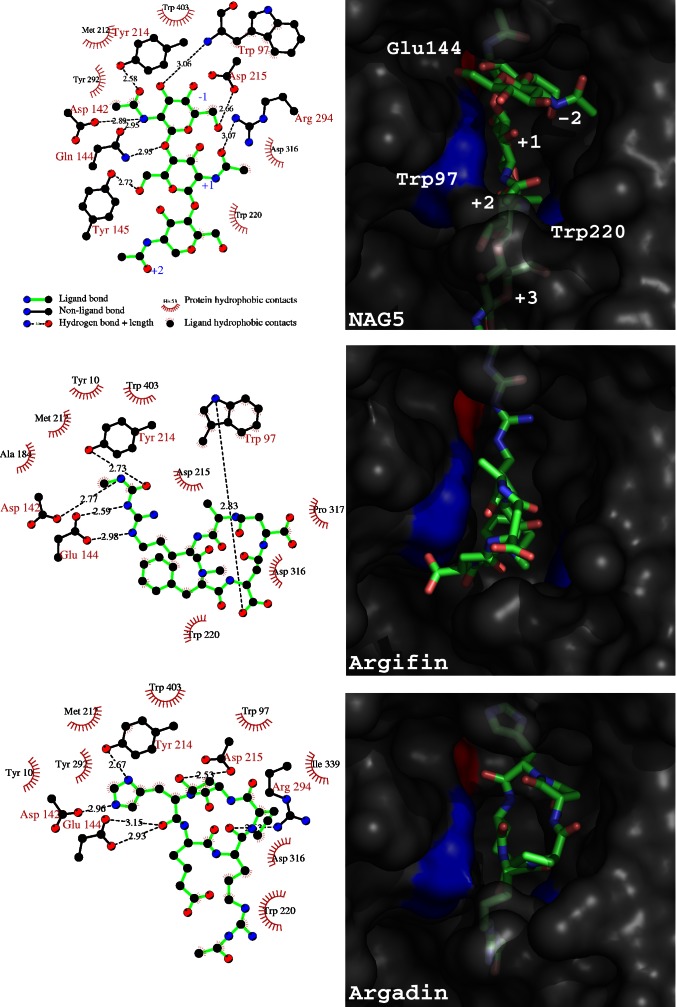
Figure 3.
Further details of inhibitor–ChiB interactions. Schematic protein–ligand interactions (Left, calculated with LIGPLOT; ref. 37) and surface plots are shown for three ChiB complexes. The ChiB–GlcNAc5 (NAG5) complex (17) is shown, for comparison purposes, together with the ChiB–argifin and ChiB–argadin complexes described here. In the schematic drawings, only protein–ligand hydrogen bonds are shown (see key). For the complex with GlcNAc5, only the central three sugars are shown. In the surface representations, the protein surface is colored gray with the exception of Trp-97 and Trp-220 (blue) and the catalytic acid Glu-144 (red). The ligands are shown in a sticks representation with carbons colored green. The sugar subsites are labeled in the GlcNAc5 complex.

