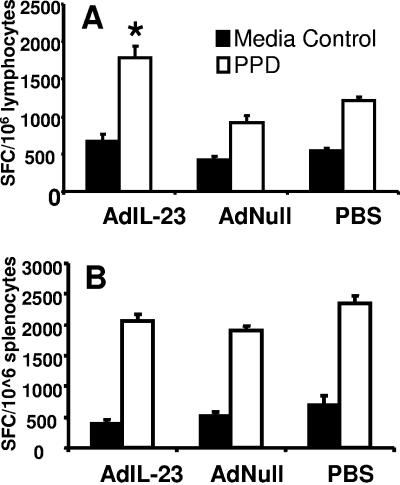
FIG. 5.
IFN-γ ELISPOT responses from (A) LALN cells and (B) splenocytes harvested from PPD-stimulated LALN cells isolated from animals 28 days after M. tuberculosis infection. ELISPOT data are shown as mean SFC counts per 106 cells in triplicate cultures using LALN cells or splenocytes pooled within each treatment group. *, P < 0.05 versus AdNull and PBS groups. n = 4 mice per treatment group. Error bars indicate 1 standard deviation in triplicate cultures.

