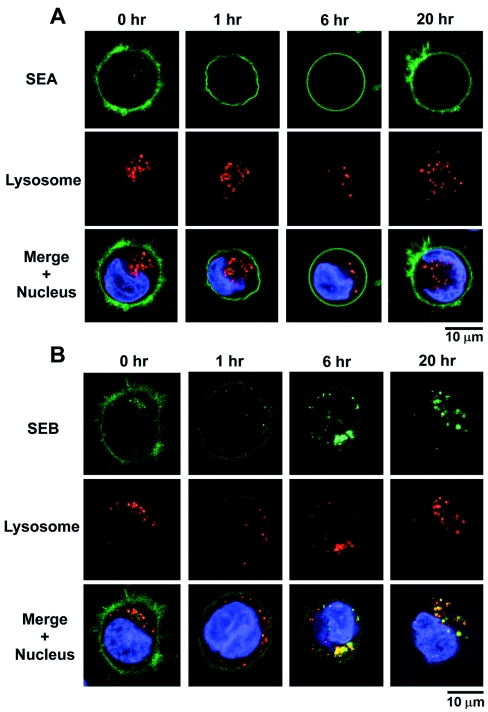
FIG. 3.
Distribution of surface and internalized SEA (A) and SEB (B) over time. SEA remained primarily on the cell surface with little or no internalization for at least 20 h. In contrast, fluorescent SEB became apparent inside the cell as it disappeared from the cell surface. By 6 h most of the internalized SEB (green) had colocalized with a marker for lysosomes (red), and by 20 h internalized SEB was exclusively associated with the lysosomal compartment. The nucleus is stained blue. The pictures are representative of three different experiments.

