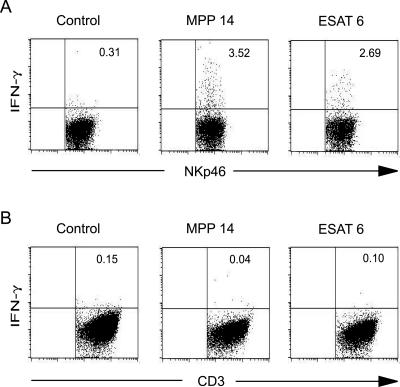
FIG. 4.
Flow cytometry plots verifying IFN-γ production by NK cells. Whole blood was stimulated with MPP14 or ESAT-6 or left unstimulated for 6 h. Brefeldin A was added to stop protein export and the samples were incubated for another 12 h. PBMC was subsequently purified by density gradient centrifugation. The cells were labeled with monoclonal antibodies against A) the NK cell marker NKp46 and B) CD3, followed by permeabilization and labeling for intracellular IFN-γ; 100,000 lymphocytes were analyzed and gated for NKp46-positive and CD3+ cells, respectively. Numbers in the upper right quadrant indicate the percentages of NK cells or CD3+ cells producing IFN-γ.

