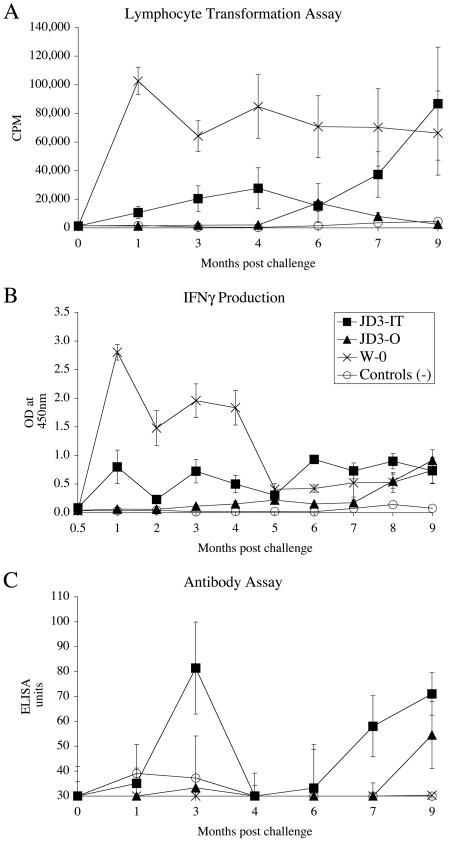
FIG. 4.
Immune profiles of animals after experimental challenge via the tonsil with the JD3 tissue homogenate (JD3-IT), represented by closed squares. Animals challenged orally with the tissue homogenate JD3 (JD3-O) are represented by closed triangles. Animals challenged orally with the W strain (W-O) are represented by crosses, and unchallenged controls are represented by open circles. (A) Mean lymphoproliferative responses of PBMC to PPDj. (B) IFN-γ responses in whole blood after stimulation with PPDj. (C) Plasma antibody levels specific to PPDj, as measured by ELISA. Mean responses ± SEM are shown (n = 12).

