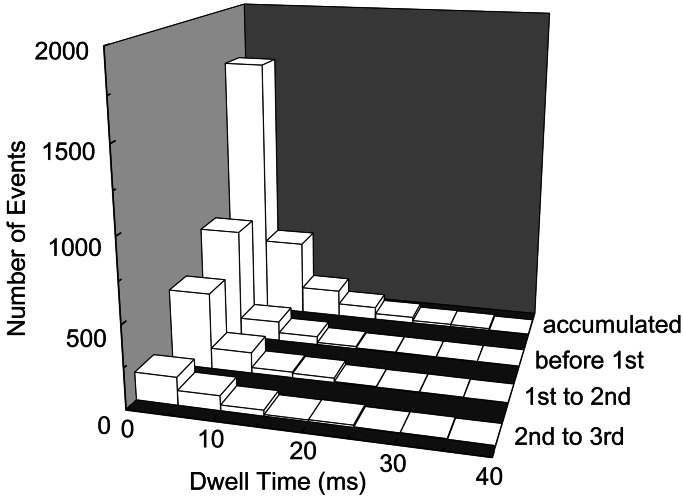
Figure 3.
A change of the dwell-time distribution with the progress of stepping movement. The distribution of the dwell time before the first step, between the first and second steps, and between the second and third steps is shown (only successive forward steps are taken into account here). The dwell-time distributions before each step are well fitted by the single exponential curves. Even though the accumulated histogram is well fitted by a single exponential curve with an average dwell time of 4.2 ms, the average dwell time for each step elongates as the stepping movement proceeds (3.1, 4.0, and 6.7 ms, respectively).

