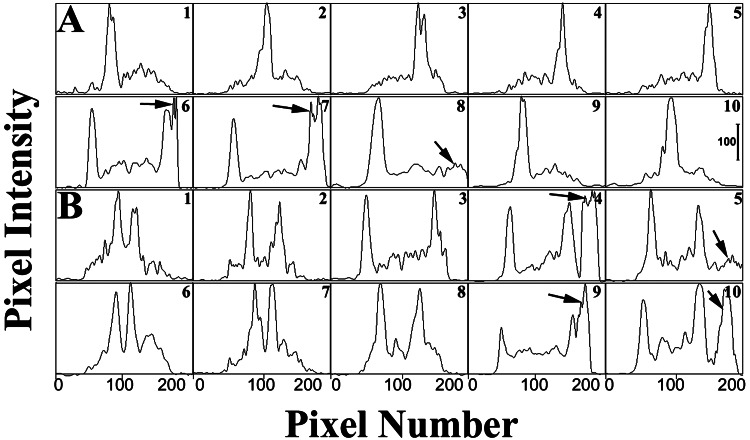
Figure 2.
Quantitative line profile analyses of fluorescence images of neutrophils in the presence of HE as described for Fig. 1. Line profiles of an untreated polarized neutrophil (A) and FMLP-stimulated cell (B) are shown. Each panel shows 10 traces at sequential time points as pixel intensity (0–255 gray levels) vs. pixel number. The intensity of each point was determined by summing the intensities for all pixels in a row (the pixel rows were perpendicular to the direction of cell orientation). The data were obtained from micrographs collected for 0.1 μsec. Each panel is separated by 25 msec. EB formation is observed in both A and B (see arrows). Two traveling NAD(P)H waves are observed in B. (Bar = 100 gray levels.)

