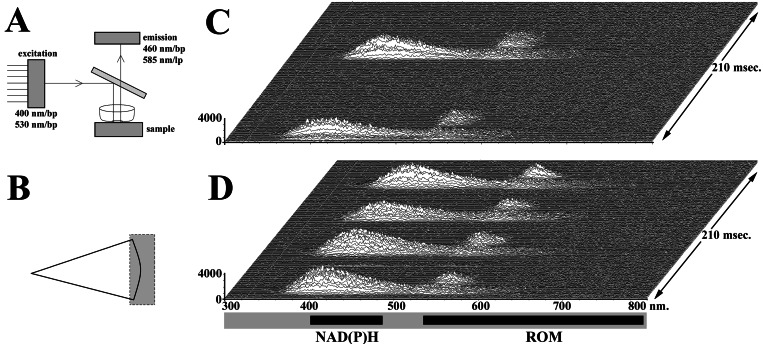
Figure 4.
High-speed microspectrophotometry experiments were performed to evaluate NAD(P)H autofluorescence and ROM production. (A) To evaluate simultaneously probes exhibiting different excitation and emission characteristics, multipass optical elements were used. The excitation filter passed bands near 400 and 530 nm, which were reflected by the dichroic mirror. The dichroic mirror transmitted light in the region of 460 and 585 nm, which were passed by the emission filter. (B) The region of the cell and environment selected for study is indicated. (C) A temporal series of emission spectra from a cell is shown. Spectra were collected for 2 msec with 0.1 msec between spectra. Wavelength (nm) is listed along the abscissa, and intensity (counts) is given at the ordinate. Time is the third dimension of the stack, as shown on the right side. Thus, ROMs are observed near the lamellipodium after NAD(P)H arrival. (D) Emission spectra of an FMLP-activated neutrophil indicate increased ROM production (n = 44).

