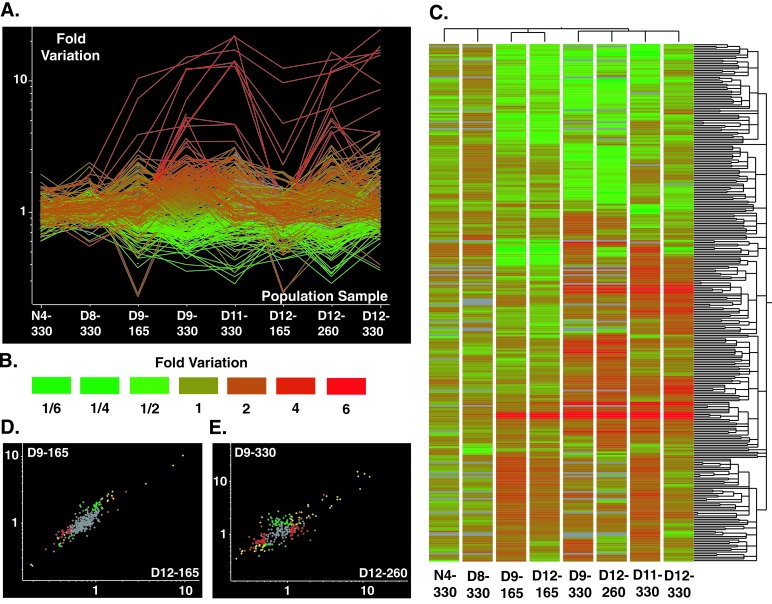
Figure 1.
Parallelism and divergence in genome-wide expression profiles. (A) Each line represents the change in expression of one of the 301 ORFs that were significantly modulated at least 1.5-fold (P ≤ 0.01) in at least one evolved population sample. The lines are colored according to the quantitative change in expression in D9-330 (see B). (B) Color scale for quantitative changes in gene expression shown in A and C. Increases in expression relative to the ancestor are shown as shades of red and decreases in expression are shown as shades of green. (C) Cluster analysis of the significantly modulated ORFs and of the experimental populations. Similarity of expression patterns of the 301 ORFs was analyzed using hierarchical clustering based on a matrix of Standard Correlations (not of distances) defined in GENESPRING and is shown as a dendrogram along the vertical axis. Similarity of expression profiles of the population samples was analyzed by the same method and is shown as a dendrogram along the horizontal axis. Data are graphically displayed with color to represent the quantitative changes in each population sample (see B). (D) Correlation in gene expression patterns between D9-165 and D12-165. The color of symbols indicate significance: red, ORFs significant in D9-165; green, ORFs significant in D12-165; yellow, ORFs significant in D9-165 and D12-165; gray, ORFs not significant in D9-165 or D12-165. (E) Correlation in gene expression patterns between D9-330 and D12-260. The color of symbols indicate significance: red, ORFs significant in D9-330; green, ORFs significant in D12-260; yellow, ORFs significant in D9-330 and D12-260; gray, ORFs not significant in D9-330 or D12-260.

