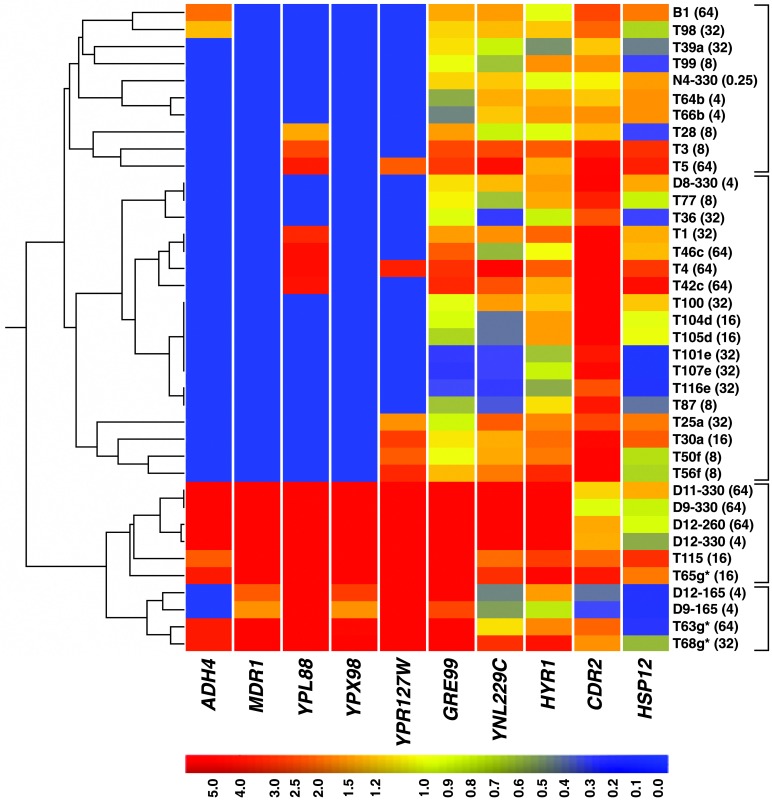
Figure 2.
Cluster analysis of expression of ten genes in clinical isolates and samples of experimental populations. Similarity of expression patterns is shown as a dendrogram along the vertical axis. Data are graphically displayed with color to represent the quantitative changes in each sample relative to the ancestor of the experimental populations (see color bar). Designations of clinical isolates begin T or B. Isolates from the same patient share the same lowercase letter. Isolates with identical multilocus genotypes and DNA fingerprints (19) are indicated with an asterisk. MIC of fluconazole (μg/ml) for each isolate appears in parentheses. The brackets indicate the four clusters discussed in the text. The dendrogram was constructed from a matrix of Standard Correlations (GENESPRING), not of distances. Because the colors saturate at 5× expression, not all primary data are represented in the graphic (see Table 5).

