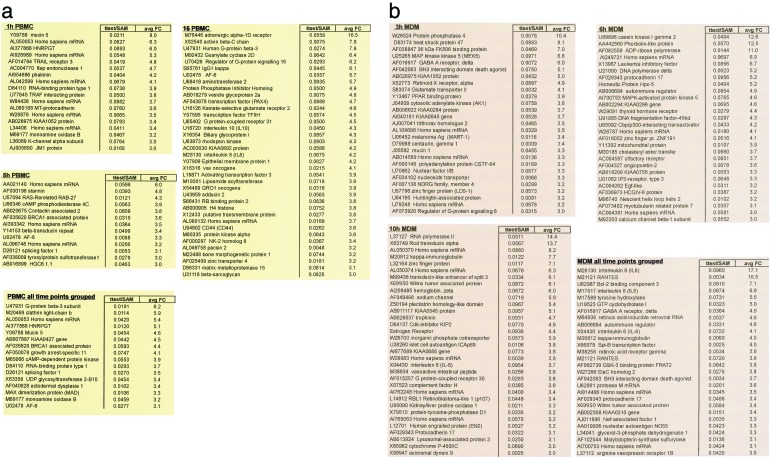
Figure 1.
Induction of genes in response to gp120 treatment. A list of genes, which were determined by sam to be significantly modulated in response to JR-FL gp120, was generated. A subset of that list that includes those genes most up-regulated is listed by time point for PBMCs (a) and MDMs (b). Responses were also evaluated by sam independent of time, and a subset of those genes that were most up-regulated is reported in the list termed “all time points.” Accession number and definition are included for each gene. avg FC, the fold change relative to PBMCs or MDMs treated with a mock protein preparation. Genes are ranked by descending fold change. Results represent the average of four donors in PBMCs or three donors in MDMs.

