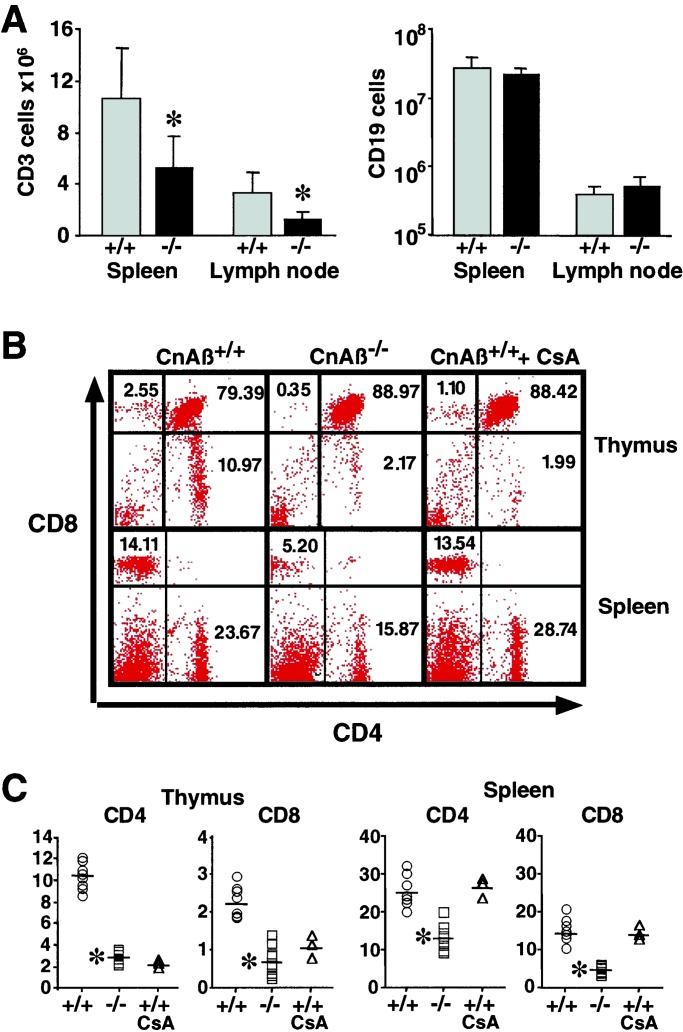
Figure 3.
Impaired T cell development in CnAβ−/− mice. (A) Total number of CD3 positive cells (T cells) and CD19 positive cells (B cells) isolated from spleen and lymph nodes were quantified by flow cytometric analysis (four independent experiments). (B) A representative FACS experiment of thymocytes (Top) or splenocytes (Bottom) from wild-type, CnAβ−/−, or wild-type mice treated with CsA were stained with FITC-CD4 and PE-CD8 antibodies. (C) Percentage of CD4- and CD8-positive cells summarized from the FACS data. (*, P < 0.01 vs. wild type).

