
Figure 3.
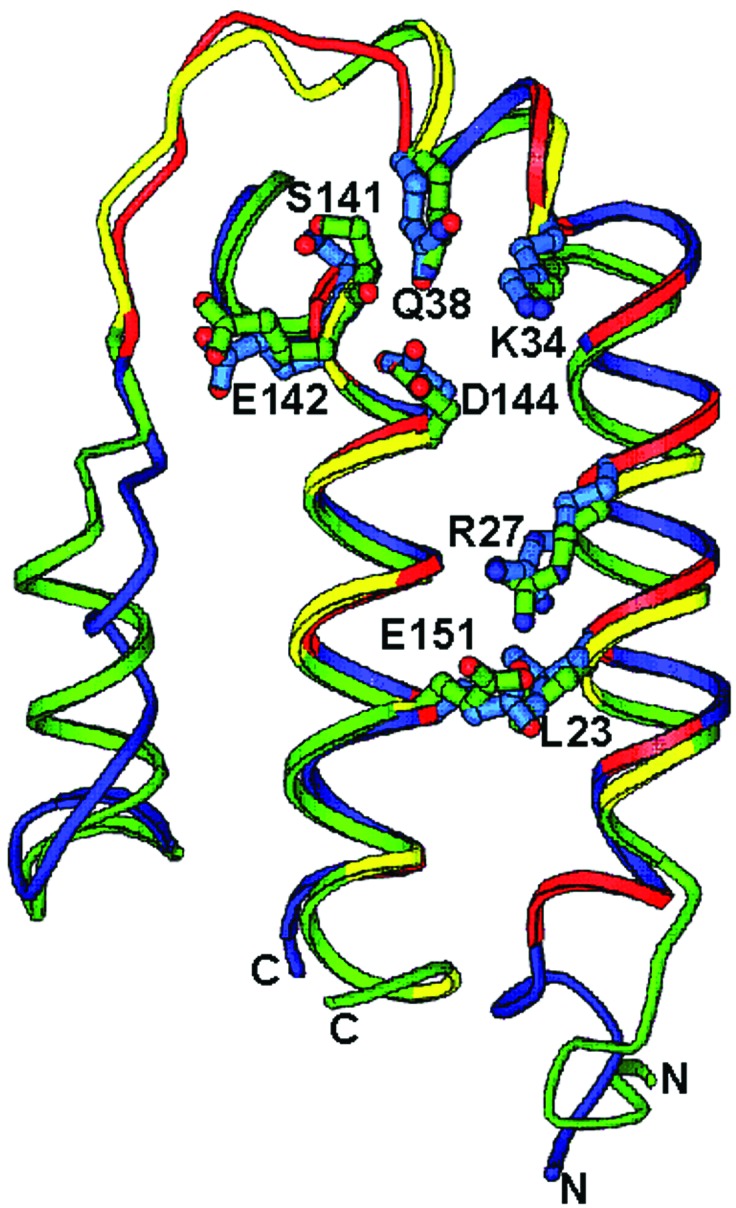
The sIL-10R1 binding epitope. cmvIL-10 and hIL-10 scaffold residues (10–62 and 137–157 for cmvIL-10, 11–62 and 137–160 for hIL-10) are shown in green and blue, respectively. cmvIL-10 residues that bury surface area into sIL-10R1 are shown in red whereas hIL-10 residues are yellow. Side chains are shown for conserved side chain residues that bury surface area into each interface.