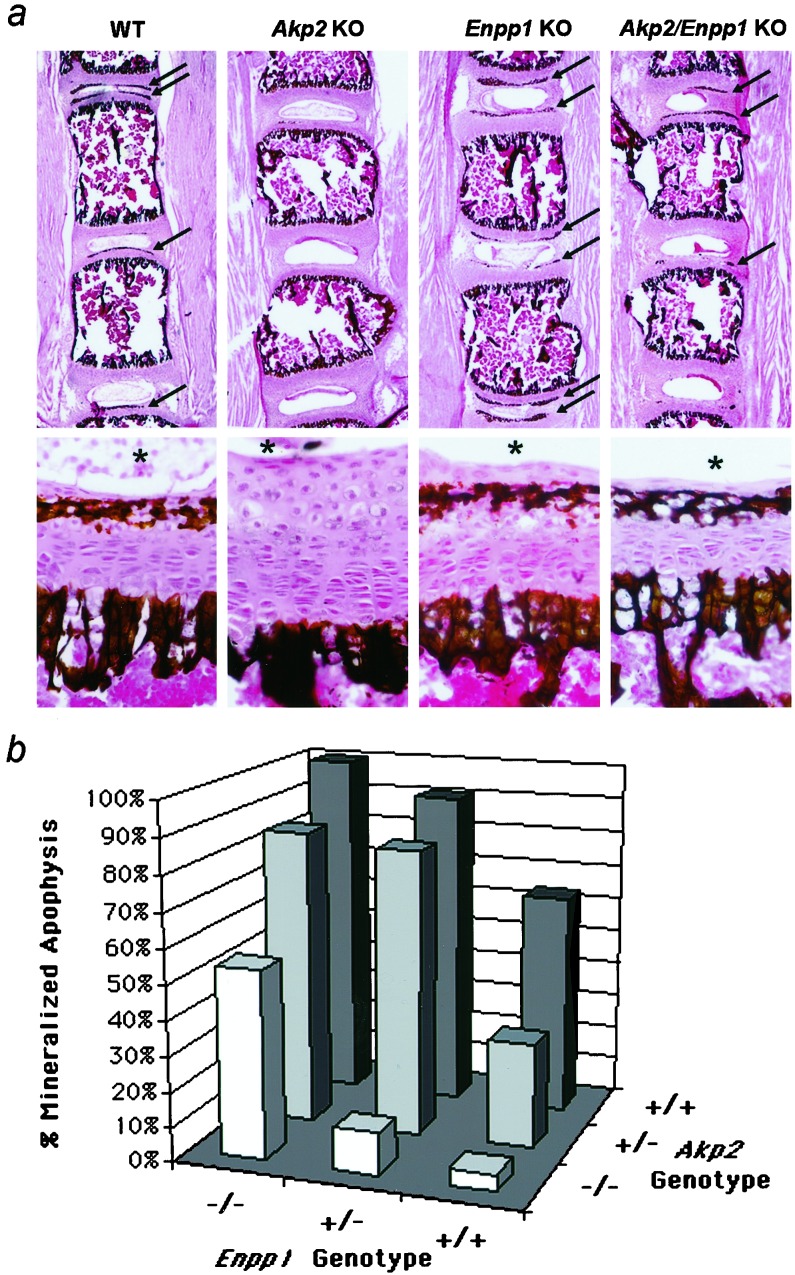
Figure 2.
Nondecalcified lumbar spine sections stained by the von Kossa procedure to visualize phosphate deposits. (a) Low (×16) and high (×240) magnification view of the 10-day-old vertebral apophyses of WT, Akp2 KO, Enpp1 KO, and Akp2/Enpp1 double-KO mice. Arrows point to mineralized secondary ossification centers in sample sections at low magnification. Note the absence of mineral deposits in sections from the Akp2 KO mice. *, relative position of the nucleus pulposus as a point of reference in the high magnification panels. (b) Graph plotting the contribution of each Akp2 and Enpp1 allele to the mineralization status of the lumbar vertebrae. The percentage of mineralized apophyses is plotted as a function of the Akp2 and Enpp1 genotypes.

