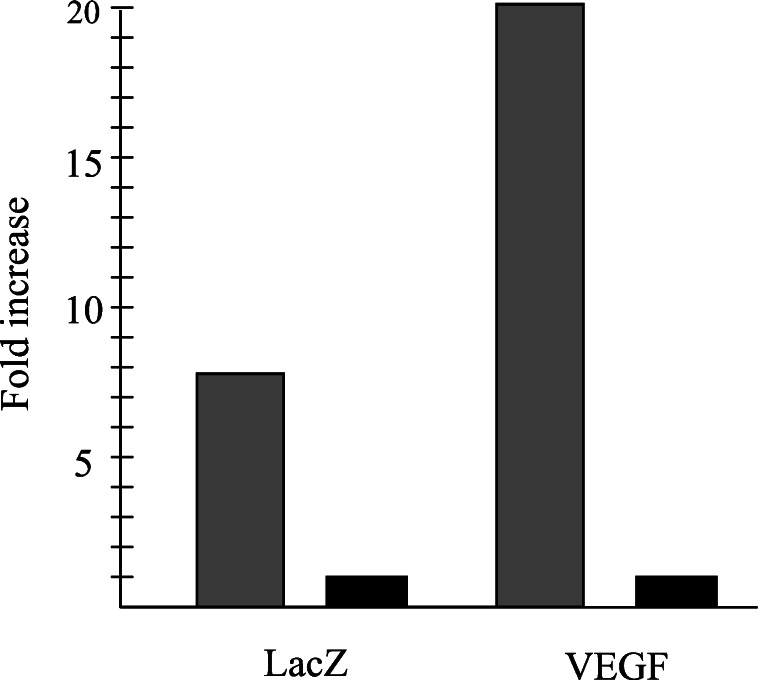
Figure 5.
Fold increase of LacZ and VEGF expression in ischemic hearts. Gray and black bars represent gene expression levels in ischemic and normal hearts, respectively. The expression levels of these two genes in normal hearts were arbitrarily assigned as one. The relative fold increases of gene expression in ischemic hearts versus in normal hearts were calculated according to the PhosphorImager analyses of semiquantitative RT-PCR data.

