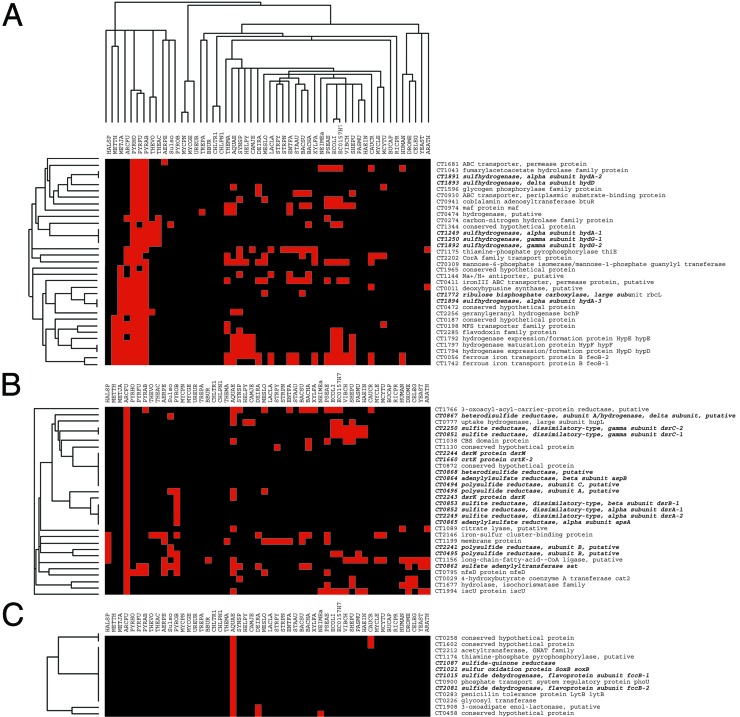
Figure 3.
Phylogenetic (PG) profile analysis of C. tepidum. C. tepidum proteins were clustered according to their distribution patterns across species for which complete genomes are available, using the single-linkage clustering algorithm with column weighting of CLUSTER (http://rana.lbl.gov). A protein was considered present (and is shown in red) if there is a match with an E-value ≤ 10−15. Clusters were viewed with TREEVIEW (http://rana.lbl.gov). (A) PG profile of C. tepidum's large subunit RubisCO homolog showing its grouping with some genes involved in S metabolism. (B and C) PG profile of many of C. tepidum's other S metabolism genes.

