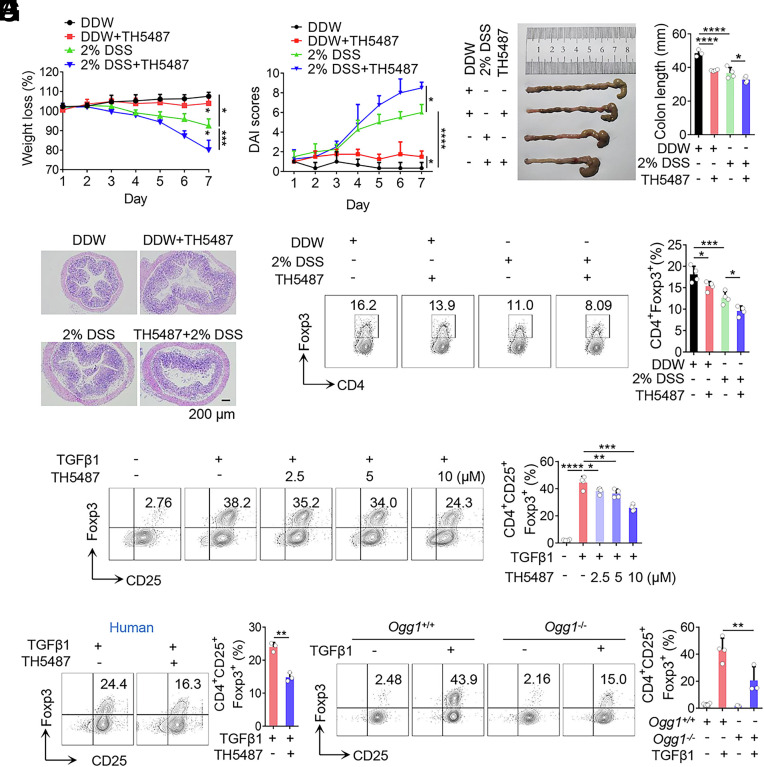
Fig. 1.
Inhibition or depletion of OGG1 decreases iTreg differentiation and exacerbates IBD in the mouse model. (A–E) Inhibition of OGG1 reduces Treg frequency in colon and aggravates mouse IBD. Mice were administered DSS (2%, w/v) in double-distilled water (DDW). Concurrently, the OGG1 inhibitor TH5487 was administered (30 mg/kg/d) intraperitoneally every other day. The solvent DMSO was used as the negative control. Colitis was systematically evaluated daily. Body weight (A) and disease activity index (DAI) scores (B)—based on body weight loss, stool consistency, and the presence of blood in the stool—were recorded daily. Seven days later, entire colons were harvested from differently treated mice for length assessment (C) and hematoxylin and eosin (H and E) staining to assess histopathological changes (D). (Scale bar, 200 μm.) iTreg frequency in colonic lamina propria were analyzed by flow cytometry (FCM) (E). (F) Inhibition of OGG1 reduces iTreg differentiation. Naïve CD4+ T cells were cultured under Th0 or iTreg polarization conditions with varying concentrations of TH5487 for 3 d and analyzed by FCM for CD4+CD25+Foxp3+ iTregs (Left) followed by quantification (Right). (G) OGG1 inhibition suppresses human iTreg differentiation. Naive CD4+ T cells isolated from human peripheral blood were cultured under iTreg polarization conditions, prior to analysis for CD4+CD25+Foxp3+ iTregs by FAM (Left) and quantification (Right). (H) OGG1 depletion significantly suppresses iTreg differentiation. Naïve CD4+ T cells derived from Ogg1+/+ or Ogg1−/− mice were cultured as described in the legend to panel (F) and stained for CD4+CD25+Foxp3+ iTreg were analyzed by FAM (Left) and quantified (Right). (A–E) One representative experiment out of four biological replicas is shown. Data represent mean ± SD (n = 4), with significance determined by two-way ANOVA test (A and B) or one-way ANOVA test (C and E). (F–H) Quantification shows mean ± SD from four (F and H) or three (G) independent experiments, with significance determined by one-way ANOVA test (F and H) or t test (G). *P < 0.05, **P < 0.01, ***P < 0.001, ****P < 0.0001.

