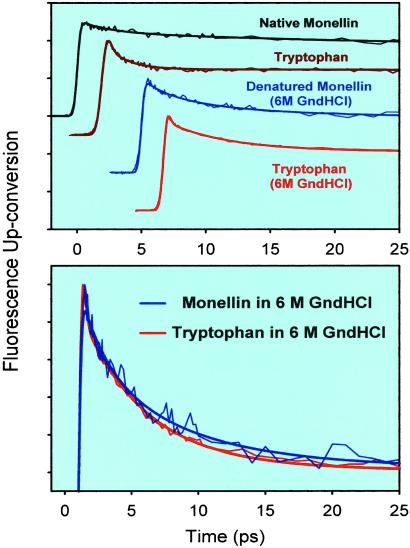
Fig 4.
(Upper) Up-conversion traces at 330 nm for solutions of Monellin and Trp in a 0.1 M phosphate buffer and in a 6 M Gdn⋅HCl (GndHCl) solution. (Lower) Comparison of the normalized decay portions of the up-conversion signals for Monellin and Trp in Gdn⋅HCl. Note that the time scale in this figure is only up to 25 ps.

