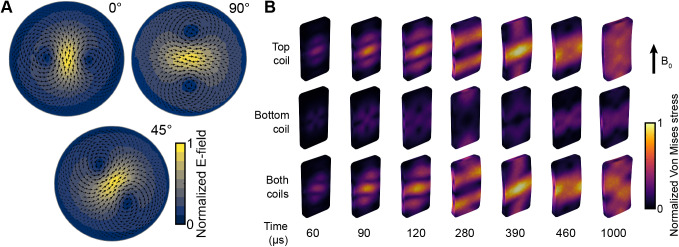
Fig. 4.
The measured E-fields and simulated stress on the coil plates. (A) E-field spatial distribution measured with the TMS characterizer on a 70-mm radius spherical head model. The 0°, 90° and 45° correspond to the E-field orientation induced with the bottom coil, top coil, and both coils together, respectively. (B) Simulated stress distributions on the coil winding plates inside the MRI bore with a 9.4-T static magnetic field (B0 ) when mTMS pulses were applied to each coil separately or to both coils simultaneously (modified fromM. A. Koponen et al. (2024)). The time is relative to the mTMS pulse onset as in the current waveform illustrated inFigure 2B.

