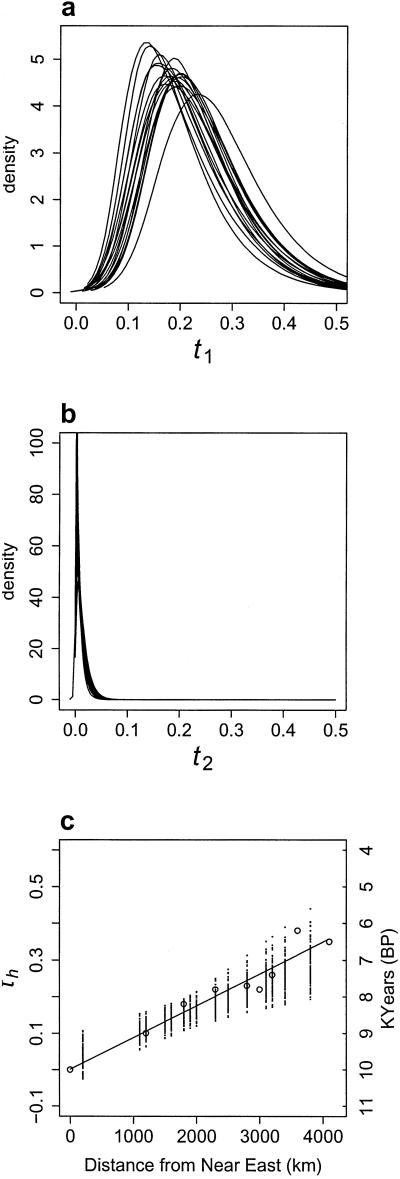
Fig 2.
Distribution of the T/Nis for all populations. (a) Posterior distributions of T/N1. The different curves represent the amount of scaled time (generations divided by population size) between the present-sample of Basques used and the ancestral population of hunter-gatherers who interbred with arriving farmers. Different T/N1 distributions are expected if the early European populations were highly differentiated from each other. This result is not what we observe. This outcome shows that the present-day samples of the Basques represent a non-biased sample of the original distribution and/or that the amount of differentiation between hunter-gatherer populations was not very high compared with drift since the admixture. The large and highly significant difference with b shows that the method is indeed sufficiently sensitive to detect different values of T/Ni. (b) Posterior distributions of T/N2. Scaled times (as in a), but for the Near East populations. (c) Linear regression of T/Nh against geographic distance. For each of the admixed population samples, one T/Nh value was randomly sampled from the corresponding posterior distribution (not shown). A linear regression was then calculated between this set of values and the set of geographic distances from the Near East. Fitted values are plotted for each of 1,000 replicates. The calibrated radiocarbon dates represent the 95% limit for the earliest date of arrival of agriculture. These dates are based on locations for which there were more than 30 available data points (S. Shennan, personal communication).

