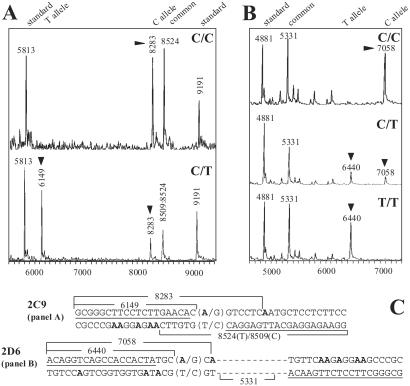
Fig 6.
Representative, high-throughput cytochromes P450 2C9 (A) and 2D6 (B) genotyping results for samples with different genotypes. ▾ points to allele-diagnostic mass peaks. C shows the sequences of the PCR amplicons and cleavage fragments (see supporting information on the PNAS web site for additional sequence and mass information).

