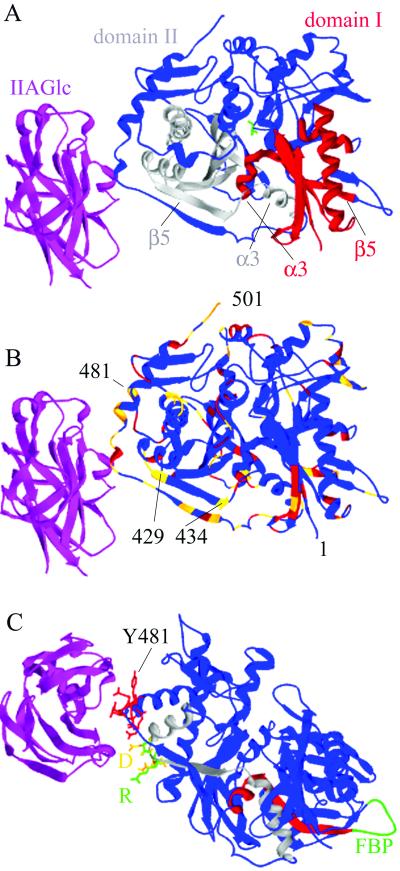
Fig 1.
Ribbon diagrams of the structure of one EcGK subunit with bound IIAGlc. IIAGlc is shown in magenta, and EcGK is shown in the remaining colors. (A) The conserved ATPase catalytic core. Glycerol is shown in green in the active site. Domain II, which contains the IIAGlc binding site, is to the left of the cleft, and domain I is to the right. The conserved ATPase motif in domain I is shown in red and in domain II in gray. The secondary structure elements α3 and β5 are labeled in each domain. (B) Amino acid differences in EcGK and HiGK. Identities are shown in blue, conservative substitutions in red, and nonconservative substitutions in gold. The N- and C-terminal positions are labeled 1 and 501, respectively, and selected residue positions are numbered. (C) The location of amino acid substitutions required to transplant IIAGlc inhibition to HiGK. The amino acids that interact directly with IIAGlc are shown as stick models in red. Amino acids 427–429 in EcGK (GTR) are shown in green and in HiGK (DVN) are shown in gold. D427 is labeled D and R429 is labeled R. Conserved ATPase catalytic core elements are colored as described for A. The loop with the binding site for FBP in domain I is shown in green and labeled FBP. The images were generated from PDB ID code by using SWISS-PDB VIEWER 3.5 (15) and rendered by using POV-RAY 3.1 for WINDOWS (www.povray.org/).

