
Table 3.
Notations with description.
| Notation | Description |
|---|---|

|
Input time-series matrix with  time steps and time steps and  sensor features sensor features |

|
Number of time steps in each input sequence |
| D | Number of input features (e.g., sensor channels) |

|
Kernel size used in temporal convolutions |

|
Dilation factor in dilated convolutions |

|
Number of convolutional filters in the  -th TCN branch -th TCN branch |

|
Total number of TCN output feature maps (sum across all branches) |

|
Output feature representation from the TCN module |

|
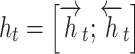
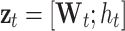
Output from BiLSTM containing forward and backward contextual features |
| H | Hidden dimension of LSTM in each direction |

|
Forward and backward hidden states at time 't' |
|
Concatenated BiLSTM hidden state at time 't' |

|
Attention alignment score at time step 't' |

|
Normalized attention weight at time step 't' |
|
Context vector computed as the attention-weighted sum of hidden states |
|
Concatenated attention and hidden feature at time step 't' |

|
Final attention-enhanced hidden representation at time 't' |

|
Attention-refined sequence of hidden representations |

|
Output vector after Global Average Pooling (GAP) |

|
Mean squared error loss for prediction accuracy. |

|
Loss for encouraging temporal consistency across outputs |

|
Attention supervision loss for pattern alignment |

|
Total composite loss function |
|
Weighting coefficients for loss terms (satisfying   ) ) |