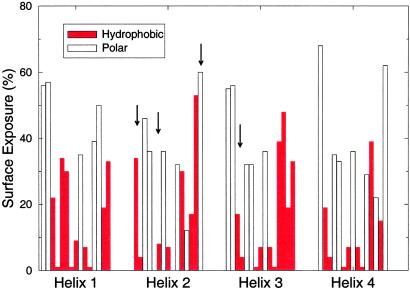
Fig 5.
Surface-area exposure for each of the four helices for structure a in Fig. 4 colored with the hydrophobic-polar pattern of the optimized sequence (red bar, hydrophobic; open bar, polar). All sites with <10% exposure are occupied by hydrophobic amino acids. Also shown are the four mutation sites (arrows) that reduce the energy gap between this structure and its competitor to zero (sites 2, 6, and 15 of helix 2, and site 3 of helix 3).

