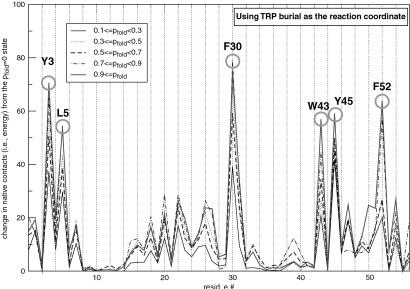
Fig 6.
Characterization of the transition state ensemble. For each trajectory, the five structures closest to the transition state (i.e., that have a probability to fold (pfold) = 0.5) were collected and then partitioned into groups having a certain pfold range. Here, the total number of native contacts made by a particular residue from an average member in each group (relative to the pfold = 0 state) is plotted. In other words, a rising peak as pfold increases from 0 to 1, such as F30, suggests a residue that participates in the transition state. Because the number of native contacts is proportional to energy, the height of the peak corresponds to the energetic importance of a residue to the transition state. In this particular plot, W43 burial was used as the reaction coordinate to monitor folding, to mimic the protocol used in ref. 26. The results did not change when energy and drms were used as the reaction coordinates. Similar nucleus residues were obtained when this analysis was repeated for the mutant trajectories.

