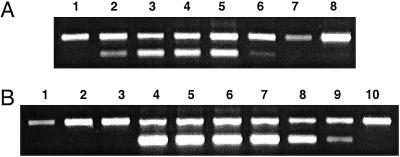
Fig 6.
Reverse transcription–PCR analysis of GSS-specific mRNA. Upper bands indicate GAPDH control (549 bp), lower bands GSS (324 bp). (A) Developmental transcript analysis of GSS in DBM. Lane 1, eggs; lanes 2 to 5, first, second, third, and fourth larval instars; lane 6, prepupae; lane 7, pupae; lane 8, adults. (B) Spatial transcript analysis of GSS in fourth-instar larvae. Lane 1, head; lane 2, body (without gut); lane 3, silk glands; lanes 4 to 9, gut parts, from anterior to posterior; lane 10, hindgut with Malpighian tubules.

