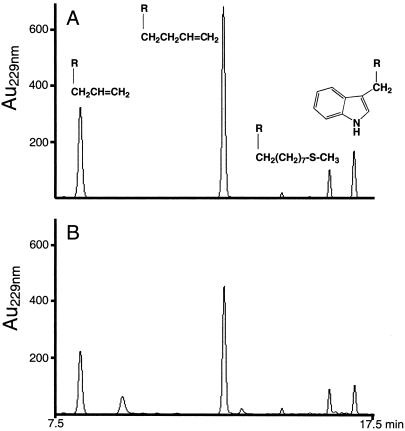
Fig 7.
HPLC chromatograms of glucosinolate profiles. (A) A. thaliana Cvi-0 leaf halves. (B) Feces of fourth-instar larvae feeding on the other halves. Extraction, separation and identification were performed as described. Shown are signals from 7.5–17.5 min. Secondary structures indicate peaks caused, from left to right, by sinigrin (2-propenyl GS), gluconapin (3-butenyl GS), glucohirsutin (8-methylsulfinyloctyl GS), and glucobrassicin (3-indolylmethyl GS).

