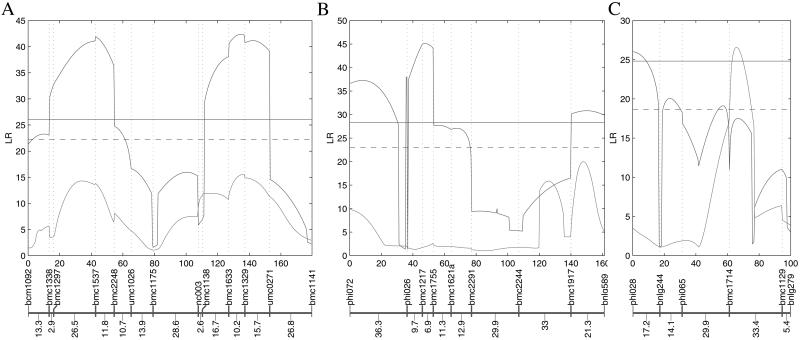
Fig 2.
The profiles of the LR test statistics for testing the QTL affecting FAA content calculated as a function of genome position on chromosomes 2 (A), 4 (B), and 9 (C). The blue curves are associated with our triploid model, whereas the pink curves with Lander and Botstein's diploid model. The significance threshold values for the triploid model [indicated by the solid (P = 0.01) and dashed (P = 0.05) horizontal lines] were estimated with 1,000 permutations (17). According to AIC (16), all of the QTL detected for FAA content are fit better by the three- rather than two-effect triploid model. Marker names and map distances (in cM) are given below each profile (11).

