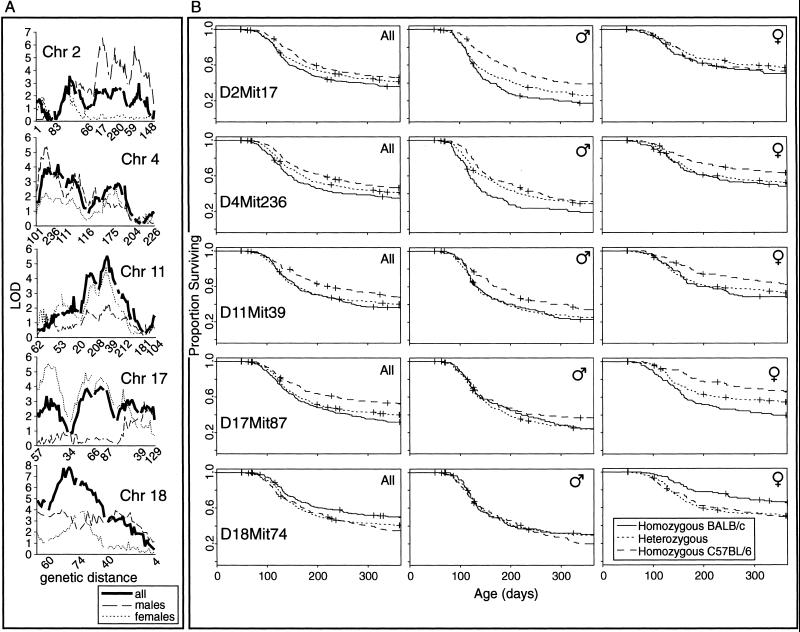
Fig 4.
Linked autosomal loci and associated survival phenotypes in 835 abl40-transgenic CBF2 mice. (A) Chromosomal scans for the five linked autosomes (centromere at left). LOD scores for all of the mice together as well as after stratification by sex are shown. Selected Mit markers are indicated along each chromosome. (B) Survival curves at the most tightly linked markers. Each graph shows three survival curves, one for each of the possible genotypes. Three graphs are shown for each marker, taking all of the mice together, and each sex separately.

