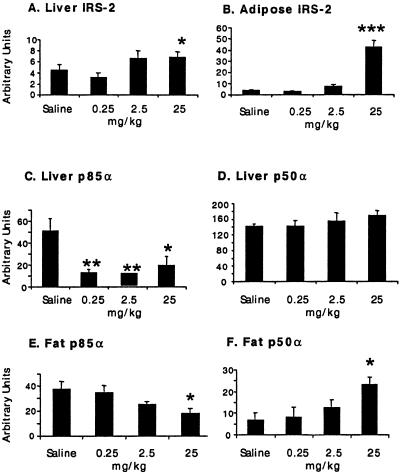
Fig 4.
PTP1B ASO treatment affects the level of IRS-2 and PI3-kinase regulatory subunit (p85α and p50α) expression in ob/ob mouse liver and fat. Representative immunoblots using anti-IRS-2 antibodies (A and B) or anti-p85α whole antiserum that recognized all p85 isoforms (C–F) were quantified. The results are the average of four mice within each group. The data are represented as arbitrary units and are the mean ± SEM. Statistics were determined as a two-tailed t test. *, P < 0.05; **, P < 0.01; ***, P < 0.001 (vs. saline control).

