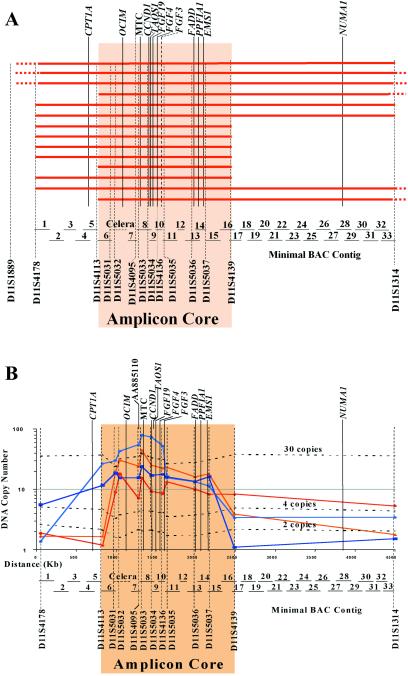
Fig 1.
Physical map of the 11q13 amplicon in oral cancer cell lines. (A) Region of amplification found in each of the 14 amplified cell lines. The red bars indicate the extent of amplification measured by QuMA for each cell line. Dashes at the end of a bar indicate that the amplified region extends outside of the area shown. The BAC contig is shown; a key to the names of the BACs can be found in Table 4, which is published as supporting information on the PNAS web site. (B) Map of the amplicon core showing the location of selected key genes in the amplicon and the QuMA data for five representative cell lines with amplification that define the amplicon core. Also shown are the locations of one new EST (AA885110) and the gene, TAOS1, both of which are highly amplified. The dashed lines represent the validation results of the primers used in QuMA. MTC, major translocation cluster identified in lymphomas.

