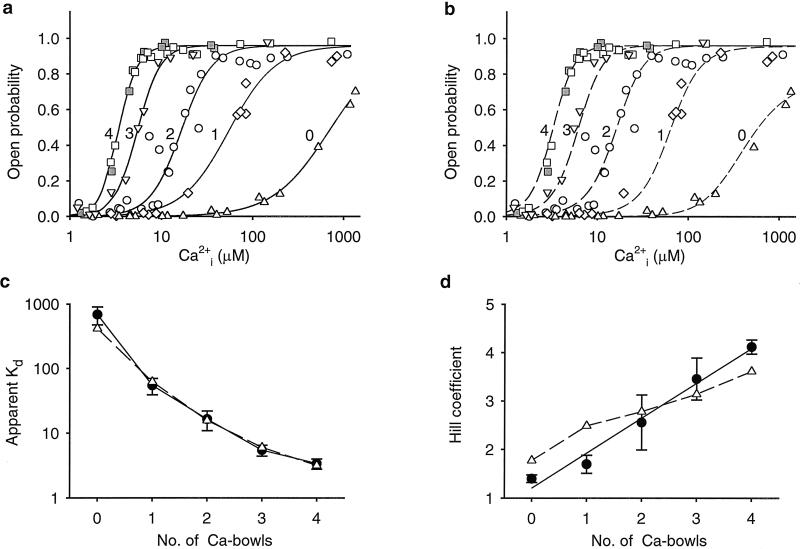
Fig 4.
Stepwise increases in the Hill coefficient and stepwise decreases in the apparent Kd as the number of functional Ca bowls increase from 0 to 4. (a) Dose-response curves for channels with 0–4 functional subunits, as indicated (upright triangles = 0, diamonds = 1, circles = 2, upside down triangles = 3, squares = 4). For each curve, data from 3–6 single-channel patches are plotted as described in Materials and Methods. The lines are fits with the Hill equation (Eq. 1), as described in Materials and Methods. All recordings had 1.5 mM TEAO except for the filled squares, which were obtained from homotetrameric wild-type channels, and the upright triangles, which were obtained from homotetrameric Ca-bowl mutated channels. (b) A model with 0–4 high-affinity allosteric activators to match the number of subunits with a functional Ca-bowl, four low-affinity allosteric activators, independent Ca2+ binding, and cooperativity arising from joint action of the allosteric activators on the opening–closing equilibrium, could approximate the data (dashed lines calculated with Eq. 2) where L(V) = 2500, K(H)C = 63.9 (±45.9) μM, K(H)O = 0.55 (±0.12) μM, K(L)C = 325 (±91) μM; K(L)O = 30.4 (±9.6) μM. The numbers in brackets indicate the uncertainty in the parameter values from the fitting and were not used in calculating the dashed lines. L(V) was fixed based on the observed Po in the absence of Ca . (c and d) Plots of Kd and the Hill coefficient versus the number of subunits with a functional Ca-bowl for the experimental data (continuous lines through filled circles) and the predictions of Eq. 2 (dashed lines through open triangles). The filled circles in c and d plot the parameters for fits of Eq. 1 to the data in a. The continuous lines in a plot these fits. The triangles in c and d plot the parameters for fits of Eq. 1 to the dashed lines in b. The fits of Eq. 1 to the dashed lines in b are not shown because they were essentially identical to the dashed lines generated by Eq. 2. The bars represent SEM.

