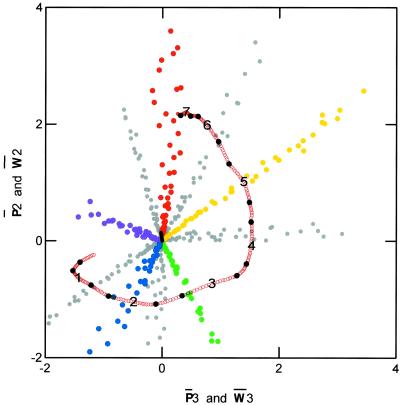
Fig 1.
Plot of the 370 color samples showing both the location of the Munsell color chips and each spectral position from 430 to 660 nm represented jointly in dimensions two and three of three-dimensional Euclidean space. The five primary colors are coded with the appropriate color, and the numbers on the spectral line represent intervals of 30 nm beginning in the lower left, where 1 indicates 460 nm. The black, filled circles indicate 10-nm intervals.

