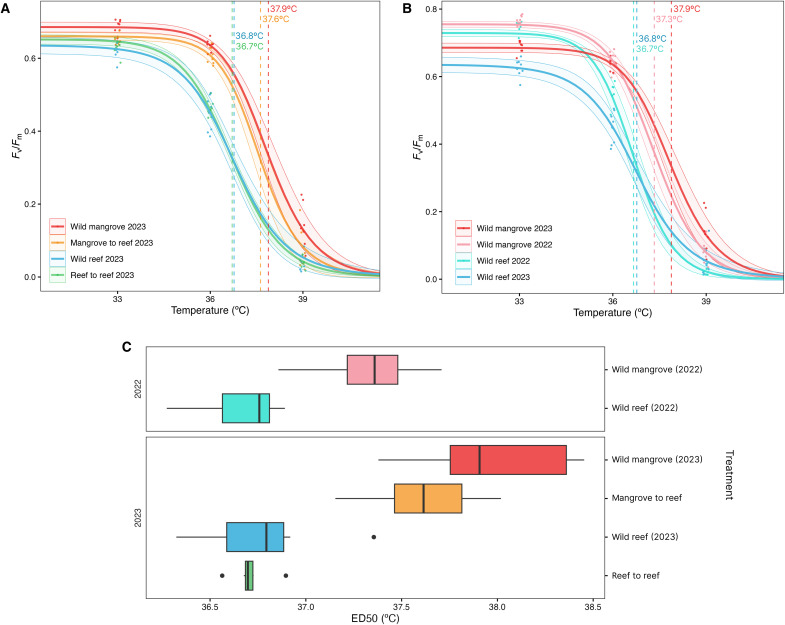
Fig. 1. Thermal tolerance responses of mangrove and reef corals to short term heat stress.
P. acuta Fv/Fm (maximum photosynthetic efficiency of photosystem II) thermal performance curves modeled using a three parameter log logistic regression model, with dashed vertical lines indicating the mean ED50 values for (A) February 2023 wild groups (wild mangrove and wild reef) versus 1-year transplanted groups (mangrove to reef and reef to reef; Kruskal-Wallis test, P < 0.001) and (B) wild mangrove and reef corals between years (February 2022 versus 2023). Shaded areas around the curves represent the 95% confidence interval and data points indicate the mean Fv/Fm for each colony within the group. (C) Box plots of group ED50 values by treatment (wild versus translocated) and year (2022 versus 2023) showing median value with upper and lower quartiles, n = 8 per group except wild reef 2022 (n = 7).

