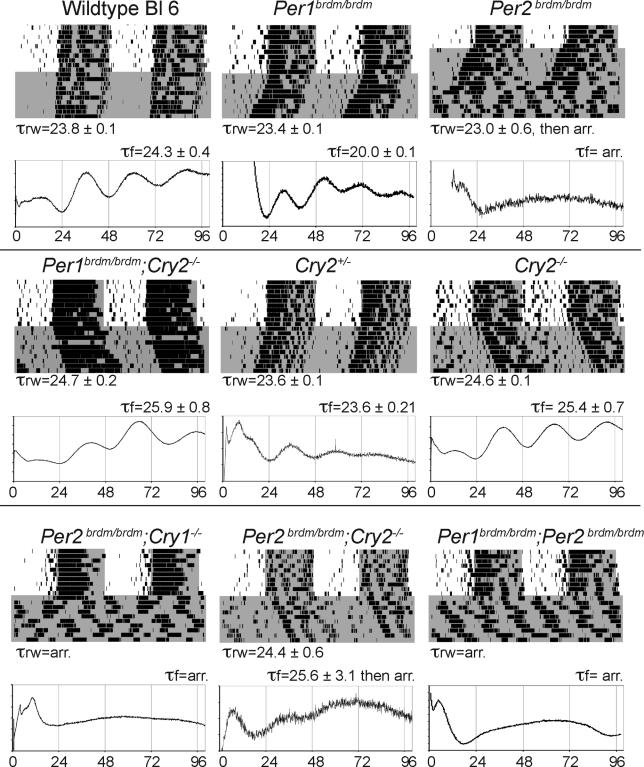
Figure 4. Comparison of the Period of Wheel-Running Behavior and of Fibroblast Bioluminescence among Mouse Strains Containing Different Circadian Gene Disruptions.
Mice of nine nearly isogenic genotypes were analyzed to obtain the period of running-wheel behavior (τrw) and the period of fibroblast luminescence (τf). For each genotype, a single running-wheel profile of the behavior of a single mouse kept first in normal light/dark conditions and then in constant darkness is shown. Periods of darkness are shaded on the graphs. Standard double-plotted actogram format is used, with consecutive rows representing consecutive days of activity, and x-axis showing time. Period lengths are presented below the graphs as average plus or minus the standard deviation for two mice, each measured twice. For each genotype, a single 100-h representative fibroblast recording is also shown. The x-axis shows time in hours; the y-axis shows arbitrary light units. Period lengths are presented above the graphs as averageplus or minus the standard deviation for two measurements of two biopsies of each mouse.

