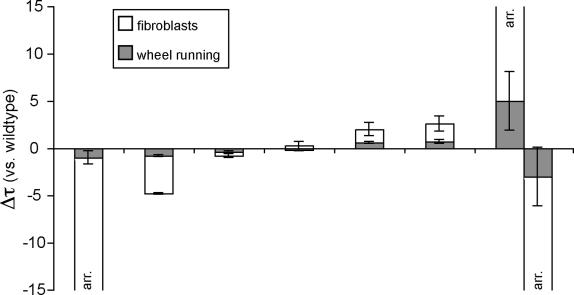
Figure 5. Genetic Differences in Circadian Period Length Measured from Fibroblasts Are Larger than Those Measured from Animal Behavior.
Data from Figure 4 depicted in stacked bar graph format. In each rhythmic strain measured, the period of wheel-running activity is shown in light grey, expressed in the difference in hours from the 24-h solar day. On top of this is shown the change in period of fibroblasts from the same animals, also measured in the difference in hours from the solar day. Genotypes depicted, from left to right, are Per2brdm/brdm, Per1brdm/brdm, wild-type, Cry2+/−, Cry2−/−;Per1brdm/brdm, Cry2−/−, Per2brdm/brdm;Cry2−/−. Because Per2brdm/brdm;Cry2−/− mice had unstable periods that ranged widely from individual to individual, this genotype is shown twice at the extreme right, with representative mice with periods both less than and greater than 24 h separated into two groups. Arrhythmic fibroblasts are designated “arr.”

