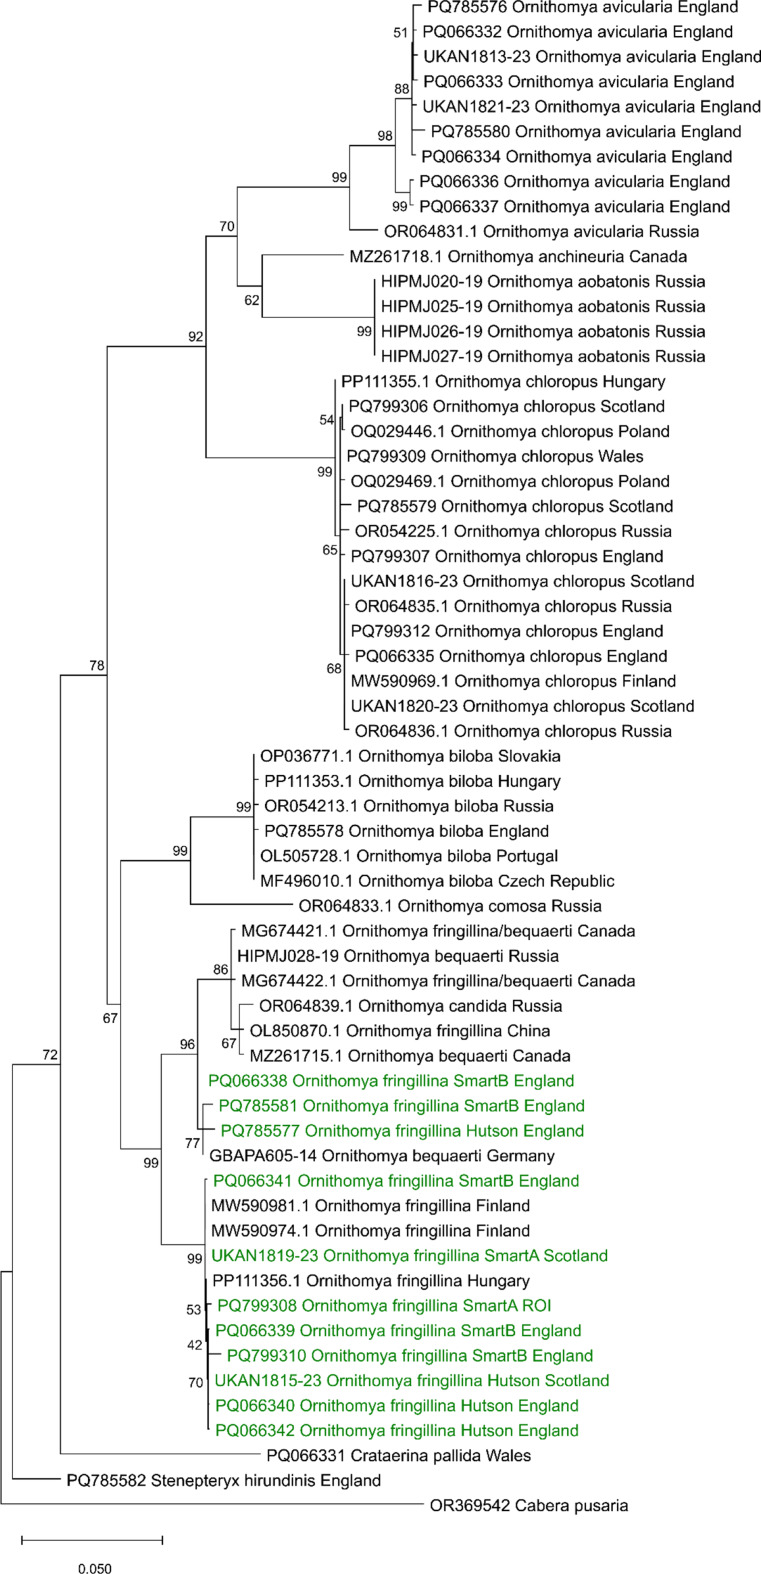
Fig. 9.
Phylogeny of the genus Ornithomya, produced from the COXI sequences, showing the morphotypes of Ornithomya fringillina, other species from the United Kingdom and Ireland (in green) compared to other sequences of the Ornithomya sp. from across their ranges. The nodes are labelled with the bootstrap values and the scale bar shows the percentage difference between sequences. The moth Cabera pusaria included as an outgroup. This phylogeny was produced from sequences aligned in R using the package DECIPHER and imported into MEGA version 12 (Kumar et al., 2024) for analysis, using three computing threads, 1000 replicates and the standard bootstrapping setting to produce a maximum likelihood tree, using a nearest neighbour interchange (NNI) and uniform rates in the Tamura-Nei model (Tamura and Nei, 1993) of nucleotide substitutions The tree with the highest log likelihood (-50,313.95) is shown

