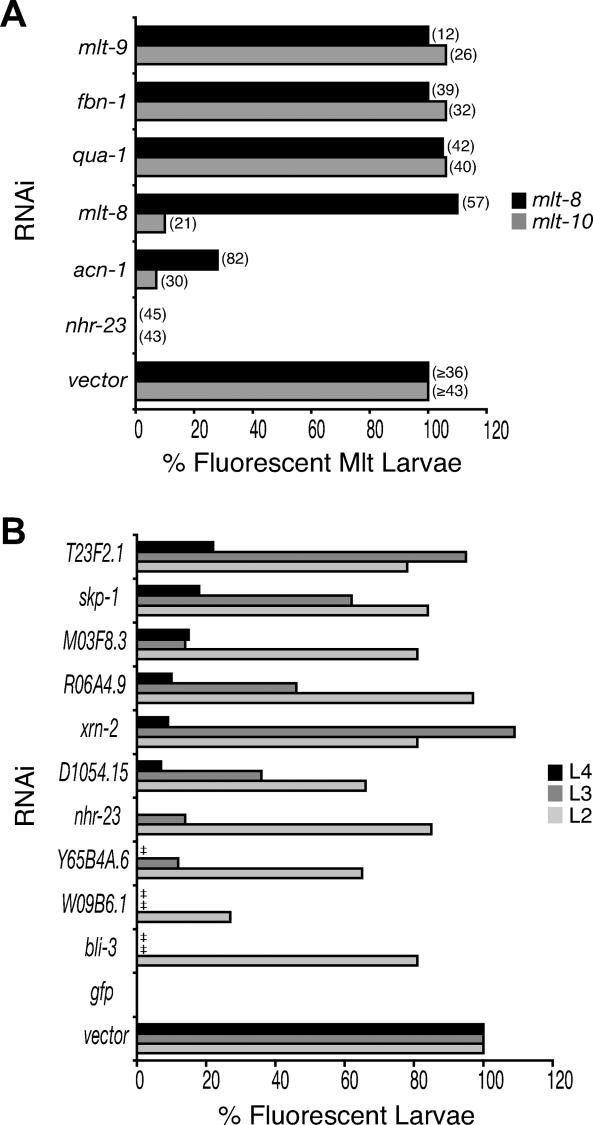
Figure 4. Ordering Gene Expression Cascades Using gfp Fusion Genes.
(A) Ex[mlt-8p::gfp-pest] or Ex[mlt-10p::gfp-pest] larvae were fed bacteria expressing dsRNA for each gene indicated. Graph shows the percent of animals that were fluorescent before a defective molt, normalized to the percent of control larvae that were fluorescent before molting from the same stage. The number of larvae observed is shown in parenthesis. Note that RNAi of mlt-8 or acn-1 typically prevented completion of the L2/L3 molt, whereas RNAi of qua-1, fbn-1, or mlt-9 interfered most often with the L3/L4 or L4/A molts. RNAi of nhr-23 blocked the L3/L4 or L4/A molts in Ex[mlt-10p::gfp-pest] larvae, but prevented completion of the L2/L3 molt in most Ex[mlt-8p::gfp-pest] larvae. In control Ex[mlt-10p::gfp-pest] larvae, fluorescence was observed in 95% (n = 56), 100% (n = 43), or 94% (n = 48) of, respectively, L2, L3, or L4 stage animals. In control Ex[mlt-8p::gfp-pest] larvae, fluorescence was observed in 74% (n = 57) or 70% (n = 36) of L2 stage, and 90% (n = 49) of L4 stage animals. Pair-wise chi-square tests indicate that the decreased fraction of nhr-23(RNAi) or acn-1(RNAi) larvae that express mlt-8p::gfp-pest, and of nhr-23(RNAi), acn-1(RNAi), or mlt-8(RNAi) larvae that express mlt-10p::gfp-pest, relative to control animals, is significant, with p ≤ 0.001 in all cases.
(B) Ex[mlt-10p::gfp-pest] larvae were fed bacteria expressing dsRNA for each gene indicated, or control bacteria not expressing dsRNA of a worm gene. Graph shows the percent of larvae that were fluorescent late in the late L2, L3, and L4 stage, normalized to control animals, with values representing the weighted average of two independent experiments. ‡ indicates that larvae failed to develop to the stage of observation. Table S5 contains the raw data contributing to this figure.

