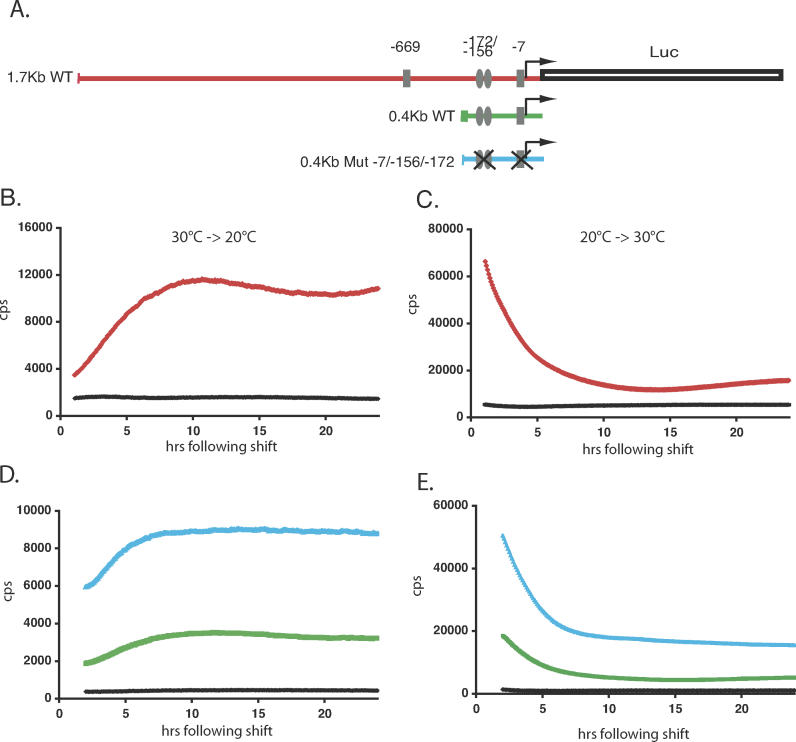
Figure 4. Temperature Steps Induce Changes in per4 Gene Transcription.
(A) Schematic representation of the 1.7-kb WT (red), 0.4-kb WT (green), and the 0.4-kb Mut −7/−156/−173 (blue) per4 promoter luciferase reporter constructs. E-box elements are represented by rectangles ( CACGTG) and ellipses ( AACGTG), and their positions relative to the principal transcription start site are labeled. E-boxes that have been ablated by mutation to the sequence ( CTCGAG) are shown by a cross [27].
(B) Bioluminescence from PAC-2 cells stably transfected with the 1.7-kb WT construct adapted to 30 °C and then shifted rapidly to 20 °C (red trace). During the entire assay, the plate was held inside the Topcount counting chamber, and each well was counted for 3 s at intervals of approximately 5.5 min. Bioluminescence (counts per second) is plotted against time (h) following the temperature shift. A black trace represents pGL3Control transfected cells bioluminescence.
(C) Equivalent experiment to that in panel B, with cells adapted to 20 °C and shifted to 30 °C.
(D and E) Cells transfected with the 0.4-kb WT and 0.4-kb Mut −7/−156/−173 constructs were subjected to the same rapid temperature decrease and increase, respectively, as described for (B) and (C).
All traces represent the mean values of 16 independent wells. Each panel is representative of at least three independent experiments.

