

Abstract
Human immunodeficiency virus type 1 (HIV-1) infection involves a selection bottleneck that leads to transmission of one or a few variants. C-C motif chemokine receptor 5 (CCR5) or C-X-C motif chemokine receptor 4 (CXCR4) can act as coreceptors for HIV-1 viral entry. However, initial infection mostly occurs via CCR5, despite abundant expression of CXCR4 on target cells. The host factors that influence HIV-1 susceptibility and selection during transmission are unclear. Here we conduct CRISPR-Cas9 screens and identify SLC35A2 (a transporter of UDP-galactose expressed in target cells in blood and mucosa) as a potent and specific CXCR4-tropic restriction factor in primary target CD4+ T cells. SLC35A2 inactivation, which resulted in truncated glycans, not only increased CXCR4-tropic infection levels but also decreased those of CCR5-tropic strains consistently. Single-cycle infections demonstrated that the effect is cell-intrinsic. These data support a role for a host protein that influences glycan structure in regulating HIV-1 infection. Host cell glycosylation may, therefore, affect HIV-1 selection during transmission in vivo.
INTRODUCTION
Human immunodeficiency virus type 1 (HIV-1) undergoes a severe viral population bottleneck during transmission. HIV-1’s high mutation rate coupled with host selective pressures leads to a large diversity of viral variants circulating during chronic infection, yet only one or a few viral variants are detected soon after infection1–7. While transmitted viruses are thought to be successful in part due to their high replicative fitness8,9 and reduced susceptibility to interferon (IFN)-mediated inhibition10,11, the most consistent, defining feature of transmitted variants is their strong coreceptor tropism preferences. HIV-1 can use either C-C motif chemokine receptor 5 (CCR5) or C-X-C motif chemokine receptor 4 (CXCR4) as a coreceptor for viral entry12, yet transmitted variants nearly always use CCR56,13 despite broad expression of CXCR4 at transmission sites14, with CXCR4-tropic (X4) viruses typically arising in the months to years after primary infection in a subset of individuals15. While CCR5-tropic (R5) viruses are, overall, more common during natural infection, the consistency of R5 virus selection across transmission settings suggests that the HIV-1 transmission bottleneck is not solely stochastic. It has thus remained a longstanding question in the HIV-1 field why R5-tropic variants, but not X4 viruses, can more successfully navigate this bottleneck, leading to new infections.
Given that CD4+ T cells are thought to be the first cells that HIV-1 productively infects after transmission1,7, host factors that inhibit HIV-1 in this important cell type may impose selective pressures that favor transmission of R5 over X4 HIV-1. Because we have previously found that genes that restrict HIV-1 in cell lines do not always have appreciable activity against HIV-1 isolates in CD4+ T cells16 (HIV-1 restriction factors reviewed in 17–21), here we sought to identify host genes that preferentially inhibit X4 HIV-1 specifically in primary CD4+ T cells. By performing comprehensive CRISPR screens and inactivation experiments in primary target cells, we discovered SLC35A2, a host protein involved in glycosylation, as an X4-specific restriction factor that has an opposite, proviral role during R5 infection. This study sheds light on the robust, tropism-dependent effects of host cell glycosylation on HIV-1 and suggests that target cell glycosylation may contribute to R5 selection during HIV-1 transmission.
RESULTS
Identification of a candidate X4-specific restriction factor
To identify X4-specific restriction factors, we performed CRISPR-knockout (KO) screens in primary CD4+ T cells and infected with an X4 strain (LAI22) and an R5 virus (Q23.BG50523) for comparison. We leveraged the HIV-CRISPR screening strategy24, which we recently adapted for use in primary T cells16. Unlike the smaller tailored library utilized in our previous study (555 genes), here we interrogated ~2,000 host genes, including many IFN-stimulated genes (ISGs) as they are a major driver of antiviral immunity (Fig. 1A; Supplementary Table 1). Screens were therefore performed in the context of type I IFN treatment. Genes required for IFN signaling were enriched for in all screens and we observed strong agreement between screens using primary T cells from different donors (Fig. 1B). By comparing R5 Q23.BG505 and X4 LAI screens and selecting LAI-specific hits, we identified 81 candidate X4-specific restriction factors, of which the top-scoring hit was SLC35A2 (Fig. 1C). This gene was of particular interest because it was highly enriched for both LAI screens and conversely scored below background for both Q23.BG505 screens (Fig. 1D). SLC35A2 transcript levels were not upregulated by IFN in primary CD4+ T cells (Fig. 1E). These data support SLC35A2’s candidacy as a non-ISG host factor that may preferentially inhibit X4 HIV-1.
Fig. 1. SLC35A2 is an X4-specific hit in a CRISPR-KO screen for HIV-1 restriction factors in primary CD4+ T cells.

a. A schematic of the HIV-CRISPR screening approach in primary CD4+ T cells. The lightning bolt represents nucleofection. After transduction and editing, cells are colored based on the unique single-guide RNA (sgRNA)-delivering lentivirus that they were transduced with. Solid bars represent sgRNA sequences, colored by sequence identity. This figure was created with BioRender.com. b. The correlation of positive MAGeCK scores between CD4+ T cell donors in Q23.BG505 (left) and LAI (right) screens. Two-sided pearson correlation results are included within each plot (P < 2.2 × 10⁻¹⁶ for both). The dotted lines denote the background for each screen based on non-targeting control (NTC) results (background = average NTC + 3 standard deviations). c. Left: Euler diagram comparing hits between Q23.BG505 and LAI screens. Screen hits are defined as gene targets that scored above background for both donors (top right quadrants from b). Right: top ten scoring LAI-specific hits, ordered by their average MAGeCK score in LAI screens. The dotted line reflects the average background from LAI screens. d. MAGeCK scores for SLC35A2 in each HIV-CRISPR screen. The dotted line indicates the average background for all screens. e. A heat map of the average IFN-induced fold changes in RNA expression for SLC35A2, housekeeping genes (GAPDH and ACTB) and canonical ISGs (MX2, ISG15, OAS1 and IFITM1) in primary CD4+ T cells at 6, 12 and 24 h post IFN treatment (n = 3 donors).
SLC35A2 differentially impacts X4 and R5 HIV-1
To validate our HIV-CRISPR screen findings, we performed single gene knockouts in primary CD4+ T cells, inactivating SLC35A2 and the B cell marker CD19 as a negative control. SLC35A2 editing led to consistently high levels of gene inactivation (average 82% KO) based on genomic DNA assessment (range: 52–96%; Fig. 2A). Across several unique donors and independent experiments, we found that SLC35A2 KO not only significantly increased infection levels of X4-tropic LAI (5.9 fold increase, p=0.004), but, surprisingly, it also significantly decreased those of R5-tropic Q23.BG505 (4.8 fold decrease, p<0.0001) (Fig. 2B). These findings were consistent for two separate assays of HIV-1 infection: quantifying reverse transcriptase (RT) activity in infection supernatants (Fig. 2B, Extended Data Fig. 1A) and measuring the percentage of cells staining positive for HIV-Gag (Fig. 2C, Extended Data Fig. 1B). Notably, based on HIV-Gag staining, an average of 73% of SLC35A2-KO cells across four unique donors (range: 64.8–83.2%) were infected with LAI compared to 13% in CD19-KO control cells (range: 9.6–16%) (5.9 fold decrease, p=0.001) (Fig. 2C). The opposite was true for Q23.BG505, with 1.8% of SLC35A2-KO cells (range: 1–2.8%) staining positive for HIV-Gag compared to 11% of CD19-KO cells (range: 7.8–16.4%) (7.5 fold increase, p=0.03). SLC35A2 KO therefore causes substantial, opposing phenotypes for these two HIV-1 strains that differ in their coreceptor usage.
Fig. 2. SLC35A2 KO differentially impacts X4 and CCR5-tropic HIV-1.

a. The percentage of SLC35A2 knockout based on evaluating genomic DNA editing by Synthego ICE. Editing experiments were performed in CD4+ T cells from five unique donors. A total of eight independent knockout experiments are depicted here, as cells were isolated from some donors multiple times for independent editing and infection experiments. The boxplot depicts the median (center line), first and third quartiles (hinges) and upper and lower limits (whiskers). All eight data points are shown. b. RT activity relative (rel) to CD19 KO at 2 dpi (MOI of 0.02) for the eight independent experiments depicted in a. Each point depicts the mean of two to three technical replicates. Two-tailed paired t-test (Q23.BG505, P < 0.0001; LAI, P = 0.0039); the asterisk indicates P < 0.05. c. Top: the percentage of CD4+ T cells staining positive for HIV-Gag at 3 dpi (MOI of 1) (n = 4 donors). Each point depicts the mean of two to three technical replicates. Two-tailed paired t-test (Q23.BG505, P = 0.0275; LAI, P = 0.0013); the asterisk indicates P < 0.05. Bottom: representative flow plots from one donor. SSC, side scatter. d. Percentage of CD4+ T cells staining positive for HIV-Gag at 3 dpi (MOI of 1), relative (rel) to CD19 KO (n = 3 unique donors, as indicated across x axis). The bars indicate the mean of two to three technical replicates, depicted by individual points. e. RT activity over time from spreading infections (MOI of 0.02) in primary CD4+ T cells from two donors, as indicated in vertical figure panels. The results are separated based on coreceptor tropism. Each point depicts the mean of two technical replicates. Additional information on the strains used for infections is presented in Extended Data Table 1.
To determine whether the observed phenotypes were specific to SLC35A2 inactivation, we exogenously expressed SLC35A2 cDNA in SLC35A2-KO CD4+ T cells. Complementation led to full or partial rescue of wild-type HIV-1 infection levels (Fig. 2D). Cases of partial rescue are likely due to the polyclonal nature of both SLC35A2 KO and complementation, as these primary cell culture experiments are not amenable to antibiotic or clonal selection. These data support the specificity of SLC35A2 KO.
Though the opposing SLC35A2-KO phenotypes for Q23.BG505 and LAI were consistent across experimental platforms, donors, and infection metrics, it is unclear what biological viral characteristics are driving these effects. One major difference between these viruses is their coreceptor usage; however, they are also from different HIV-1 clades and LAI is lab-adapted whereas Q23.BG505 is not. To understand which viral features represent determinants of SLC35A2 KO’s impact on HIV-1 infection, we infected SLC35A2-KO and CD19-KO CD4+ T cells with five X4 and five R5 full-length HIV-1 strains from various clades and consisting of both primary and lab-adapted viruses (Extended Data Table 1). We observed a strikingly consistent pattern – SLC35A2 KO increased infection levels for all X4 strains whereas all R5 viruses exhibited lower levels of infection (Fig. 2E, Extended Data Fig. 2A). Coreceptor tropism for each strain was confirmed by individually inactivating CXCR4 and CCR5 in CD4+ T cells (Extended Data Fig. 2B). Notably, the effects of SLC35A2 KO were intermediate to those of coreceptor inactivation, suggesting that SLC35A2 partially inhibits, but does not fully ablate, X4 HIV-1 infection.
In addition to X4 and R5 HIV-1, we investigated the effect of SLC35A2 KO on two viruses considered dual-tropic (93BR02025 and 89.626). These results closely recapitulated those of X4 HIV-1 (Fig. 2E, Extended Data Fig. 2A), which agrees with our findings from coreceptor KO cells that indicated that both 93BR020 and 89.6 rely on CXCR4 substantially more than CCR5 (Extended Data Fig. 2B). Inactivation of SLC35A2 therefore differentially impacts HIV-1 based on whether viruses use CXCR4 or CCR5 as a coreceptor for viral entry.
SLC35A2 modulates the composition of glycans on host cells
SLC35A2 is a multichannel membrane protein that transports UDP-galactose from the cytosol into the Golgi27–29. This process is critical for normal glycosylation as galactose is a common residue on both N- and O-glycans. Therefore, SLC35A2 inactivation results in truncated glycans that lack galactose. Naturally occurring SLC35A2 polymorphisms are associated with a congenital disorder of glycosylation characterized by epileptic encephalopathy.
To determine whether SLC35A2 KO disrupts glycosylation in our primary cell system, we stained SLC35A2-KO CD4+ T cells with two lectins that bind terminal glycan residues that would be expected to be exposed with the loss of galactose (Fig. 3A). Specifically, Griffonia Simplicifolia lectin II (GSL-II) preferentially binds terminal GlcNAcs on N-glycans and Vicia Villosa lectin (VVL) recognizes terminal GalNAcs, which are residues specific to O-glycans30. We found that, on average, 89% and 88% of SLC35A2-KO cells were positive for GSL-II and VVL binding, respectively, compared to 3% and 2% of CD19-KO cells (Fig. 3B). Complementation of SLC35A2-KO cells dramatically reduced lectin binding, demonstrating the specificity of this phenotype to SLC35A2 and further supporting the magnitude of SLC35A2 KO in our system (Fig. 3C). Therefore, editing of SLC35A2 in this cell type substantially disrupts host cell surface glycosylation by causing the truncation of both N- and O-glycans.
Fig. 3. SLC35A2 inactivation causes truncated glycans on host cells and impacts HIV-1 entry in a cell-intrinsic manner.

a. General schematic of glycans, including the truncations expected with SLC35A2 inactivation. GSL-II and VVL lectin terminal residue binding sites are indicated with arrows. The figure was created with BioRender.com. b. The percentage of cells staining positive for GSL-II and VVL lectins in CD4+ T cells (n = 4 donors). Each point depicts the mean of two to three technical replicates. c. The percentage of cells staining positive for GSL-II and VVL lectins in CD4+ T cells in SLC35A2-KO cells delivered exogenous SLC35A2 cDNA (SLC Rescue) (n = 2 donors, as indicated across the x-axis). The bars indicate the mean of three technical replicates, depicted by individual points. d. The relative (rel) viral infectivity, as a percentage of CD19 KO, of supernatants collected 6 days after low MOI infection (MOI of 0.02) from three donors. The relative infectivity was calculated by dividing the viral infectivity (infectious particles (IP) per microliter) by the RT activity (mU RT per microliter). Each point depicts the mean of three technical replicates. e. The percentage of GFP+ CD4+ T cells, relative (rel) to CD19 KO, 2 days after infection with GFP-expressing HIV-1 pseudoviruses (MOI of 1) (n = 4 donors). Each point depicts the mean of two to three technical replicates. Two-tailed paired t-test (Q23.BG505, P < 0.0001; LAI, P = 0.0489); the asterisk indicates P < 0.05. f. The percentage of GFP+ CD4+ T cells, relative (rel) to CD19 KO, after 2 days of infection with GFP-expressing HIV-1 or VSV-G pseudotyped virus (MOI of 1) (n = 3 donors). Infections with the different pseudoviruses were performed in parallel to allow for direct comparisons between viruses. Each point depicts the mean of three technical replicates. g. The fold change in the level of RT intermediate products 18 h after infection with replication-competent HIV-1 (MOI of 2), compared with CD19 KO. For CD19 and SLC35A2 KO, three donors were tested, indicated by individual points. A heat-inactivated (heat inact.) virus was used in parallel as a control for one donor. Each point depicts the mean of three technical replicates. h. The percentage of CD4+ T cells staining positive for HIV-Gag 3 days after infection (MOI of 1) with or without the use of spinoculation and polybrene, which were tested in parallel to allow for direct comparisons between infection conditions (n = 2 donors, as indicated in figure panels). The bars indicate the mean of three technical replicates, depicted by individual points.
SLC35A2 impacts HIV-1 entry in a cell-intrinsic manner
Though lectin staining demonstrates altered glycosylation on target cells, HIV-1 itself is heavily glycosylated. For instance, the envelope proteins (Envs) of the viruses used in our study thus far (Extended Data Table 1) contain a median of 28 putative N-glycan sites (X4 range: 28–34, R5 range: 25–30; p=0.15, two-tailed unpaired t-test). Viral glycans are likely similarly altered upon replication in SLC35A2-KO cells. Because our infections have utilized replication-competent HIV-1, the observed tropism-specific SLC35A2-KO HIV-1 phenotypes may be driven by altered glycans either on host cells or on HIV-1 virions after passaging in SLC35A2-KO cells. If changes in viral glycans were driving SLC35A2’s effects on HIV-1, we would expect that X4 virus produced in SLC35A2-KO cells would have increased infectivity compared to wild-type, whereas R5 HIV-1 would have the opposite trend. Nevertheless, we found that SLC35A2 KO slightly decreased HIV-1 infectivity for both Q23.BG505 and LAI (1.4 fold and 1.6 fold, respectively; Fig. 3D). Notably, this small effect on infectivity was in the opposite direction of SLC35A2 KO’s enhancing effect on X4 infection.
To further evaluate how host glycosylation is impacting HIV-1 infection, we made X4 and R5 HIV-1 pseudoviruses, which are capable of infection but not making infectious progeny virions and are generated in cells with wild-type levels of SLC35A2. We found that SLC35A2 KO impacted these HIV-1 pseudoviruses within a single infection cycle in the same manner as replication-competent virus, with reduced R5 infection (10.8 fold decrease, p<0.0001) and enhanced X4 infection (2.6 fold increase, p=0.049) (Fig. 3E, Extended Data Fig. 1C). In fact, the magnitudes of these effects were similar to those from replication-competent infection (Fig. 2C) and consistent across four unique donors. Because single-cycle infections eliminate the possibility that SLC35A2 KO is acting on glycosylation of the virus, these results indicate that the effect of SLC35A2 KO on HIV-1 is driven by changes to glycans on target cells, not on progeny virus.
We next performed infections with pseudovirus bearing the vesicular stomatitis virus (VSV) envelope protein (VSV-G), thus isolating the impact of entry from downstream stages in viral replication. We observed no impact of SLC35A2 KO on VSV-G pseudovirus infection (1.1 fold decrease; Fig. 3F), whereas the expected effects were observed for the HIV-1 pseudoviruses used in parallel (Q23.BG505: 7.7 fold decrease, LAI: 2 fold increase). Because the only difference between these pseudoviruses are their envelope proteins, which function to mediate viral entry, these findings indicate that SLC35A2 is impacting HIV-1 during viral entry in an Env-specific manner. Consistent with these results, we also found that SLC35A2 KO increased the frequency of both early and late reverse transcription products after infection with replication-competent X4 virus (7.6 fold and 7 fold, respectively; Fig. 3G). These data further support the conclusion that SLC35A2-mediatied restriction of X4 virus occurs during entry.
Our infections thus far have utilized spinoculation and polybrene treatment, which are commonly used to increase infection efficiency by promoting attachment between HIV-1 and host cells31. By performing side-by-side infections of SLC35A2-KO and wild-type cells with or without these methods, we found that SLC35A2’s effect on X4 infection was more pronounced when these techniques were not employed (Donor 1 example: 3 fold effect of SLC35A2 KO with techniques and 52 fold effect without; Fig. 3H). Moreover, SLC35A2 KO alone had a larger effect on promoting X4 infection than spinoculation and polybrene treatment combined (Donor 1 example: 52 fold effect from SLC35A2 KO and 38 fold effect by using techniques). These findings were reproducible in an additional donor (Fig. 3H). These data not only establish that SLC35A2 phenotypes are not dependent on in vitro techniques to promote viral infection, but they also demonstrate that the impact of SLC35A2 KO on X4 HIV-1 infection exceeds that of the viral attachment-enhancing methods of spinoculation and polybrene.
SLC35A2 does not impact HIV-1 receptor/coreceptor expression
Because SLC35A2’s impact on HIV-1 is tropism-dependent and occurs during viral entry, we next investigated whether receptor (CD4) or coreceptor (CXCR4, CCR5) expression is impacted by SLC35A2. We assessed surface protein expression on wild-type and SLC35A2-KO cells on the day of HIV-1 infection by flow cytometry and found that essentially all cells expressed CD4 (Fig. 4A). To capture relative protein levels, we examined the median fluorescence intensity (MFI) of cells expressing a given surface protein. Though SLC35A2-KO cells had a significantly elevated CD4 MFI in one donor (p=0.04), this effect was weak (increase of 12%) and not reproducible. Like CD4, there were also no consistent, substantial differences between wild-type and SLC35A2-KO cells in the percentage or MFI of cells staining positive for CXCR4 and CCR5 (Fig. 4B and 4C). Though SLC35A2-KO cells displayed a statistically significantly higher frequency of CXCR4+ cells than CD19 KO (p=0.01), the effect size was less than 3% (98% and 95.3% CXCR4+, respectively). Given that over 95% of cells express CXCR4 in both conditions, it is unlikely that these small differences could, for example, lead to the 52 fold increase caused by SLC35A2 KO on LAI infection without spinoculation (Fig. 3H). Thus, SLC35A2’s effect on HIV-1 infection cannot be explained by changes in HIV-1 coreceptor expression.
Fig. 4. SLC35A2 does not impact HIV-1 receptor or coreceptor expression.
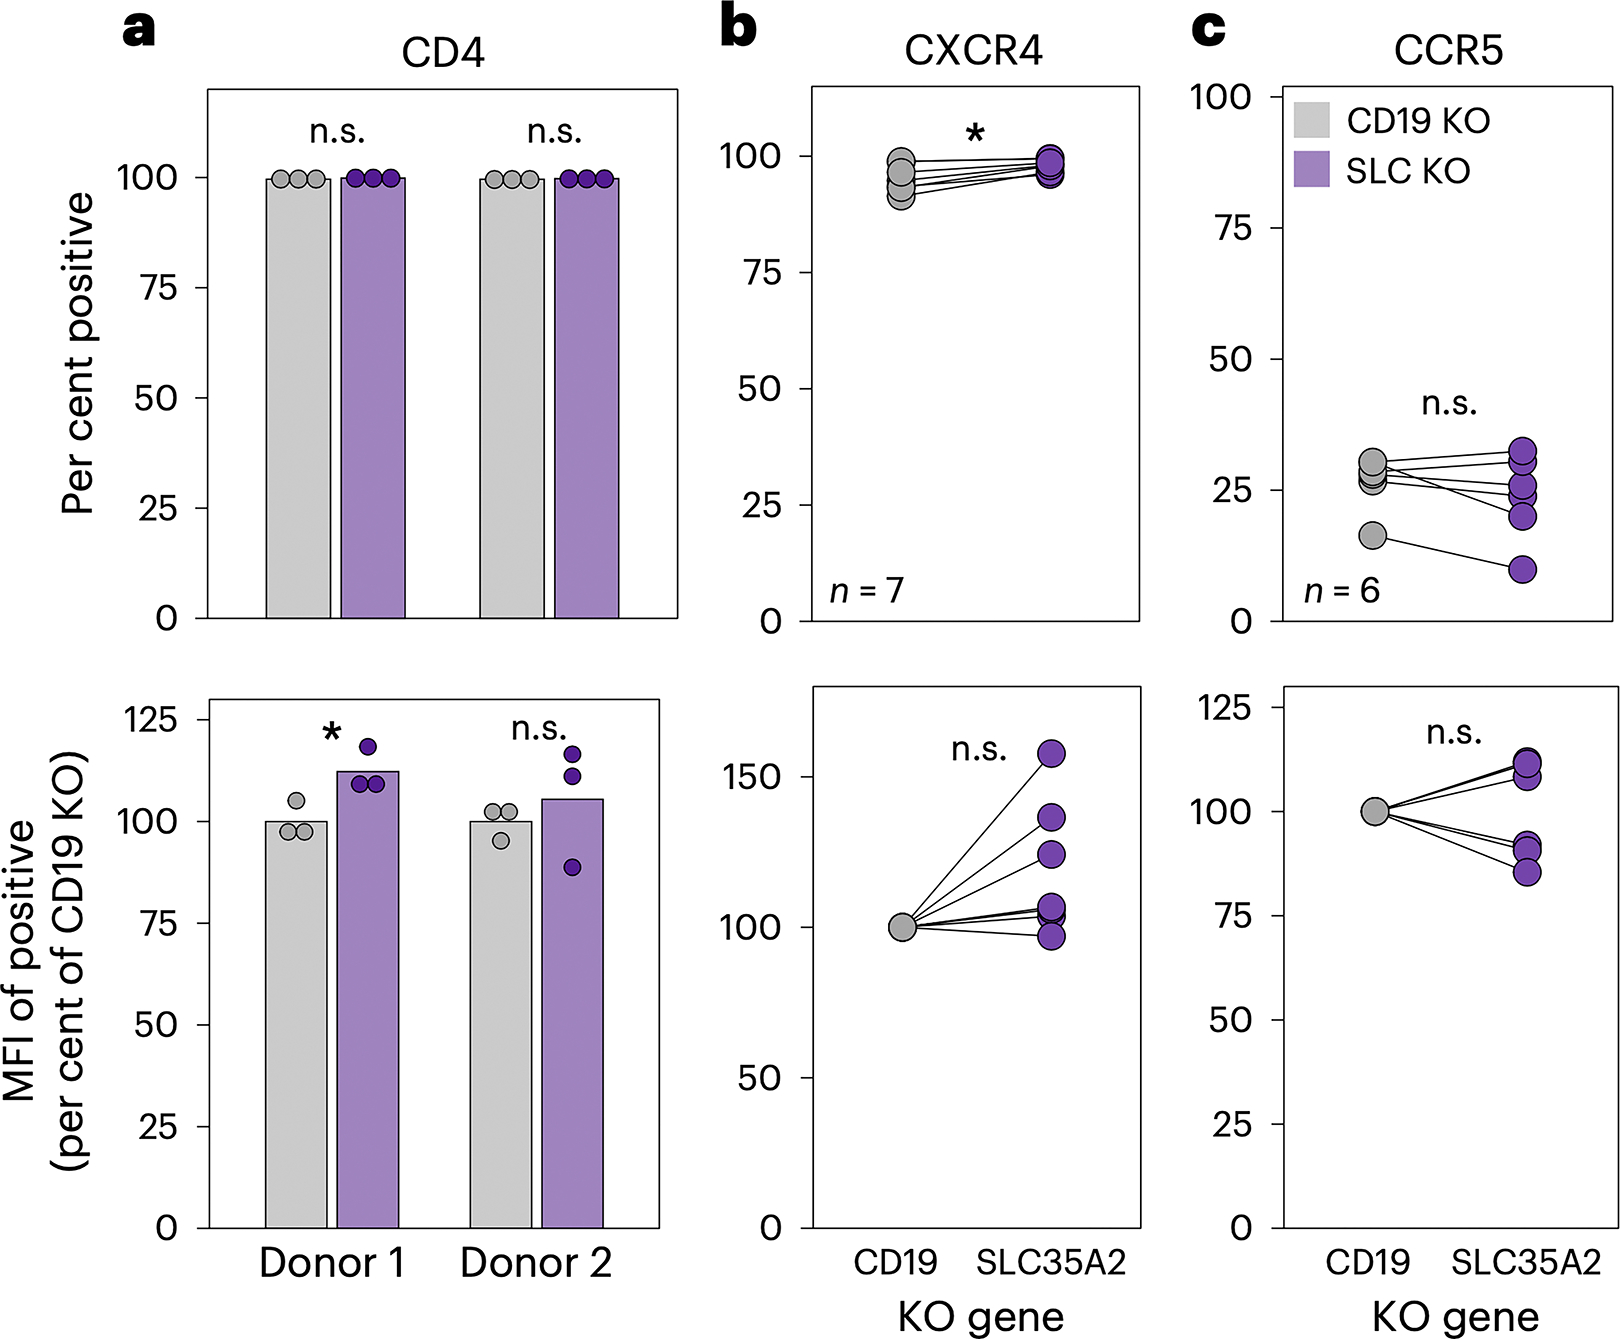
a. Surface protein expression of CD4, CXCR4 and CCR5 on CD4+ T cells analyzed by flow cytometry. Top: the percentage of cells staining positive for each surface protein. Bottom: the MFI of the positive population, relative to CD19 KO. CD4 expression was evaluated in CD4+ T cells from two donors, as denoted on the x axis. The bars indicate the mean of three technical replicates, depicted by individual points. Two-tailed unpaired t-tests (donor 1, P = 0.041). b,c. CXCR4 (b) and CCR5 (c) levels were measured in four donors for a total of seven and six independent experiments, respectively, as cells were isolated from some donors multiple times for independent editing experiments. Each point depicts the mean of two or three technical replicates. Two-tailed paired t-tests were applied for b (top, P = 0.007) and the bottom of c. A two-tailed Wilcoxon rank test was used to evaluate the top of c. The asterisk indicates P < 0.05. n.s., not significant (P > 0.05).
DISCUSSION
In this study, we identify SLC35A2, a host protein involved in glycosylation, as a potent X4-specific cellular restriction factor of HIV-1 in the main target cells of HIV-1 infection, primary CD4+ T cells. Interestingly, the presence of SLC35A2 has an opposite, enhancing effect on R5 infection. Our findings uncover an opposing role for CD4+ T cell glycans on R5 and X4 HIV-1 infection, whereby R5 HIV-1 prefers wild-type target cell glycosylation and X4 viruses are more successful when host glycans are truncated, such as in the setting of SLC35A2 KO (Fig. 5). These effects are cell-intrinsic and occur early in infection, during viral entry. Notably, the antiviral effect of SLC35A2 on X4 HIV-1 remained robust even in the absence of in vitro techniques commonly used to promote HIV-1 infection, further supporting the in vivo relevance of this restriction factor.
Fig. 5. Working model of the impact of CD4+ T cell glycosylation on HIV-1 infection.

Created with BioRender.com.
The results from our study uniquely demonstrate that the composition of glycans on host cells differentially impacts HIV-1 viral entry based on coreceptor tropism. Because this work was performed in a physiologically relevant, primary target cell model, it is plausible that SLC35A2-driven glycan features may contribute to R5 selection during natural HIV-1 transmission. In fact, mucosal CD4+ T cells in the vaginal tract, a common site of HIV-1 transmission, express SLC35A2, CXCR4, and CCR5 RNA at levels comparable to or higher than those in the blood, which is the CD4+ T cell population used in our study (Extended Data Fig. 3)32. Likewise, SLC35A2 protein levels on the Human Protein Atlas33 are characterized as high in the vagina, endometrium, cervix, and rectum and as medium in the bone marrow and lymph node. These data indicate that SLC35A2 is present at functional levels in target cells at important HIV-1 transmission sites. This supports the possibility that this X4 restriction factor may contribute to R5 selection during transmission, which can be seeded by infection of blood and/or mucosal-derived CD4+ T cells depending on the transmission route and context of exposure. Future experiments using CD4+ T cells isolated from the mucosa or in ex vivo tissue explants will help address the role of SLC35A2 and host glycosylation on mucosal HIV-1 transmission suggested by this work and may also inform whether this phenotype is consistent across subsets of CD4+ T cells. Notably, SLC35A2 expression reduces the efficiency of X4 infection but does not ablate it in the same way as coreceptor inactivation. These data are consistent with the fact that X4 viruses do evolve in the host, perhaps at times when the viral evolution pressures of adaptive immunity and host cell availability outweigh that of SLC35A2-mediated restriction, resulting in the emergence of X4 viruses.
By uncovering a tropism-dependent role for target cell glycosylation on HIV-1, our study adds to recent evidence highlighting the importance of virus-glycan interactions during infection. Until now, the impact of host glycans on HIV-1 infection was singularly investigated in the context of R5 viruses. For instance, a recent study by Ma et al34 showed that memory CD4+ T cells from the blood and tonsils that have higher levels of binding to WGA, a lectin that binds sialic acid and GlcNAc, are more susceptible to R5 HIV-1 infection34. Further, removal of sialic acid directly reduced R5 infection. Because sialic acids are absent in the setting of SLC35A2 KO, our findings uncover a potential cellular driver for these findings.
While our study highlights a fundamental role for host glycans on HIV-1, the precise mechanism(s) driving the tropism-dependent effect of SLC35A2 KO remain to be determined. Our single-cycle infection and viral infectivity data indicate that the opposing effects of SLC35A2 on HIV-1 infection are driven by a cell-intrinsic mechanism, as SLC35A2 inactivation impacted infections with pseudovirus and replicating viruses with similar trends and magnitudes, whereas there was a negligible effect of SLC35A2 KO on viral infectivity. Moreover, SLC35A2 KO had no impact on pseudovirus carrying VSV-G in place of HIV-1 Env, narrowing the effect of SLC35A2 to viral entry. Our data also indicate that these effects cannot be explained by changes in CD4, CCR5, or CXCR4 expression levels. Together, these data are consistent with the model that SLC35A2-driven host cell glycosylation restricts viral entry of X4 HIV-1 but enhances that of R5 HIV-1.
Investigating the interactions between HIV-1 and host surface glycans may provide insights into the specific cell-intrinsic mechanisms contributing to SLC35A2’s phenotypes. For instance, the glycans on both CXCR4 and CCR5 are on their extracellular N-termini35–37 and this region of CCR5 is known to interact with HIV-138. It is therefore possible that the composition and structure of glycans on the coreceptors directly impact HIV-1 binding and/or fusion. However, CD4+ T cells express a variety of glycoproteins and a recent study concluded that general glycan-glycan interactions between HIV-1 and the host cell may enhance attachment39. If broad glycan-glycan interactions were driving SLC35A2’s tropism-specific effects, viral glycosylation levels would likely need to vary based on coreceptor usage. Because the X4 and R5 Envs in our study did not vary in their levels of glycosylation, general glycan-glycan interactions are unlikely to be driving SLC35A2’s phenotypes.
Elucidating the mechanisms driving the SLC35A2-KO phenotypes would be expedited by working in a cell line model. However, cancer cells, which are often used to establish cell lines, have a high prevalence of altered glycans40. In fact, Jurkat T cells, a T cell line commonly used in HIV-1 studies, have truncated O-glycans due to a mutation in a chaperone required for O-glycan synthesis, C1GALT1C1/Cosmc41. Efforts to study the impact of host cell glycans on HIV-1 in cell lines must therefore evaluate the suitability of the cell line and ensure that it recapitulates wild-type glycosylation of primary CD4+ T cells.
We identified SLC35A2 by performing comprehensive HIV-CRISPR screens in primary CD4+ T cells. This robust screening approach, coupled with the relevance of a primary cell model, represents a powerful tool for identifying cellular factors that impact HIV-1 and likely influence natural infection. Though we focused on SLC35A2 in this study, there are additional candidate restriction factors that could be pursued. For instance, B2M, SYNGR2, and BST2 were the next top-scoring X4-specific hits in our screens. B2M is a component of major histocompatibility complex (MHC) class I molecules, which may suggest a previously unexplored, cell-intrinsic role for MHC I in inhibiting HIV-1 infection, perhaps X4 HIV-1 in particular. Of note, B2M has recently been found to facilitate Vaccinia virus entry, providing evidence for a role for MHC I during viral replication42. SYNGR2, a membrane protein implicated in regulating membrane trafficking, was identified as a proviral factor for bunyavirus infection and is hypothesized to promote the formation of bunyavirus replication complexes43. Unlike B2M and SYNGR2, BST2/Tetherin, is a well-studied HIV-1 restriction factor that prevents viral egress and is antagonized by the HIV-1 accessory protein Vpu (reviewed in 19). Tetherin has now been classified as an X4 LAI-specific hit in three independent HIV-CRISPR screens – those reported here, our previous screens with a different library16, and HIV-CRISPR screens in THP-1 cells24. Because Tetherin is more sensitive to antagonism by Vpu proteins from primary HIV-1 isolates44, which are generally R5 viruses, these screen results may be driven by Vpu differences or coreceptor tropism. Our findings thus identify additional candidate X4-specific restriction factors in CD4+ T cells that can be validated against a broad panel of X4 and R5 viruses to understand whether they confer tropism-specific effects.
Overall, our findings identify SLC35A2 as a cell-intrinsic, X4-specfic restriction factor and reveal a tropism-dependent impact of target cell glycosylation on HIV-1 entry. These results provide a promising avenue of investigation to address a long-standing question in the field regarding HIV-1 transmission. Understanding the interactions between host glycans and HIV-1 that confer differential impacts on R5 and X4 HIV-1 may inform the development of prophylactic approaches to specifically target viral variants that are successful in the HIV-1 transmission bottleneck.
METHODS
Cell lines
HEK293T/17 (ATCC #CRL-11268) and TZM-bl cells (NIH HIV Reagent Program #ARP-8129) were cultured in DMEM complete media (DMEM (Gibco #11965092) supplemented with 10% FBS (Gibco #26140079), 2 mM L-glutamine (Gibco #25030081), 1X antibiotic-antimycotic (Gibco #15240062) that contains penicillin, streptomycin, and Amphotericin B).
HIV-1 viruses
HIV-1 Q23.BG50523 is a clade A, CCR5-tropic HIV-1 chimeric virus derived from a full-length provirus isolated early in infection (Q2345) and bears the BG505.C2 envelope46 of a well-studied clade A transmitted/founder virus. HIV-1 LAI is a clade B, CXCR4-tropic HIV-1 strain, as previously described22. Infectious molecular clones (IMCs) of Q23.BG50523 and LAI22, as well as Q2345, SF16247, and NL4–348 (NIH HIV Reagent Program ARP-2852, contributed by Dr. M. Martin) were generated by transfection using proviral plasmids. The remaining viruses were obtained as viral stocks through the NIH HIV Reagent Program, Division of AIDS, NIAID, NIH: HIV-1 92/UG/021 (ARP-1648), HIV-1 92/UG/029 (ARP-1650), HIV-1 92/UG/024 (ARP-1649), and HIV-1 93/BR/020 (ARP-2329) contributed by UNAIDS Network for HIV Isolation and Characterization; HIV-1 Ba-L (ARP-510) contributed by Dr. Suzanne Gartner, Dr. Mikulas Popovic, and Dr. Robert Gallo49; HIV-1 93/MW/965 (ARP-2913) contributed by Dr. Paolo Miotti and the UNAIDS Network for HIV Isolation and Characterization; HIV-1 89.6 (ARP-1966) contributed by Dr. Ronald Collman50.
HIV-1 production
HIV-1 IMCs and pseudoviruses were prepared by transfecting HEK293T/17 cells in a six-well format. Twenty hours prior to transfection, 5e5 cells/well were plated in 2 mL of DMEM complete. For each HIV-1 IMC transfection well, 1 μg of proviral DNA and 200 μL serum-free DMEM were combined, prior to the addition of 3 μL of FuGENE (Promega #E2692). Pseudoviruses were also made by transfections using plasmids expressing the envelope of BG505.C246, LAI (gift from Dr. Michael Emerman), or VSV-G (gift from Dr. Michael Emerman) and Q23ΔEnv.GFP51 (NIH HIV Reagent Program ARP-12647). For each HIV-1 pseudovirus transfection well, 667 ng of envelope DNA, 1.334 μg of Q23ΔEnv.GFP, and 200 μL serum-free DMEM were combined, prior to the addition of 6 μL of FuGENE. Transfection complexes were gently mixed, incubated for 15–30 minutes at room temperature, and added to each well in a drop-wise manner. At 20 h post-transfection, media was replaced with 1.5 mL of DMEM complete per well. Supernatants were harvested two days post-transfection and clarified using a 0.2 μM filter (Millipore Sigma #SCGP00525). Transfection supernatants were concentrated using Amicon 100 KDa concentrators (Millipore Sigma #UFC910024) and titered on TZM-bl cells, as previously described16.
Lentiviral plasmids
Lentiviruses were used to deliver the CRISPR guide library to CD4+ T cells for HIV-CRISPR screens and SLC35A2 cDNA to SLC35A2-KO CD4+ T cells for rescue experiments. To generate the lentiviral vector for HIV-CRISPR screens, the packageable ISG knockout assembly (PIKA) guide library was amplified from the HIV-CRISPR PIKA library plasmid24 and cloned into the HIV-TOP opt mChΔW13 plasmid for primary CD4+ T cell screens, as previously described16. To generate the lentiviral vector for SLC35A2 rescue experiments, SLC35A2 cDNA (393 aa, NCBI Reference Sequence: NP_001035963.1) was codon-optimized and synthesized by Twist Bioscience, amplified, and cloned into the TOP-CAR expression vector52. Specifically, the codon-optimized SLC35A2 fragment, WPRE-LTR from the HIV-CRISPR PIKA plasmid24, and AgeI- and PmeI-digested TOP-CAR were assembled using HiFi DNA Assembly Master Mix (NEB #E2621L) to generate the TOP-SLC35A2 expression plasmid.
Lentivirus production
Lentiviruses were transfected as described above for HIV-1 production, using the following transfection reagents per well: 667 ng of transfer vector (HIV-TOP opt mChΔW with the PIKA guide library or TOP-SLC35A2), 500 ng of psPAX2 packing vector (Addgene #12260), 333 ng of the pMD2.G VSV-G expression vector (Addgene #12259), 200 μL serum-free DMEM, and 4.5 μL TransIT-LT1 transfection reagent (Mirus Bio #MIR-2305). Lentiviral transfections were concentrated over a sucrose gradient, as previously described16.
Preparation of ribonucleoproteins (RNPs)
Non-targeting control (NTC) RNPs utilized one single guide RNA (sgRNA) from IDT, whereas RNPs for all other single gene KOs were assembled using a mixture of three sgRNAs from Synthego (Synthego Gene KO Kit v2). Guide sequences are available in Supplementary Table 2. RNPs were prepared with Cas9-NLS protein (UC Berkeley QB3 MacroLab) as described previously16.
Overview of primary CD4+ T cell experiments
In brief, this study reports three types of primary CD4+ T cell editing and infection experiments: (1) single gene editing, (2) HIV-CRISPR screens, and (3) SLC35A2 rescue experiments. All primary CD4+ T cell experiments utilize the following methods and timeline, with additional methods for specific experiments as indicated: CD4+ T cell isolation on Day 1, CD4+ T cell activation on Day 1, transduction of CD4+ T cells with lentivirus on Day 2 (CRISPR screens and SLC35A2 rescue experiments only), Cas9 delivery and genomic editing of CD4+ T cells by nucleofection on Day 4, and HIV-1 infection on Day 14. This experimental timeline and all related methods were recently described in detail by our group for different KOs and HIV-CRISPR screens than those reported here16. General protocols, as well as methods specific to CRISPR screens and SLC35A2 rescue experiments, are described in the following five sections.
Primary CD4+ T cell isolation and activation
Whole blood from healthy donors collected in EDTA tubes was obtained from BloodWorks Northwest. Peripheral blood mononuclear cells (PBMCs) were isolated from whole blood by centrifugation over Ficoll-Paque Plus (Cytiva #17144002). CD4+ T cells were isolated using negative selection (STEMCELL Technologies #17952) and were immediately cultured in complete RPMI media (RPMI 1640 (Gibco #22400089) supplemented with 10% FBS, 2 mM L-glutamine, 1X antibiotic-antimycotic) with 100 U/mL recombinant interleukin (IL)-2 (Roche #11147528001) and activated or frozen in freezing media (90% FBS, 10% DMSO). CD4+ T cells were used directly after isolation for HIV-CRISPR screens and were thawed from frozen aliquots for all other experiments. After isolation or thawing, cells were resuspended at 2.5e6 cells/mL in 48-well flat-bottom plates with complete RPMI media and 100 U/mL IL-2. Cells were activated with plate-bound anti-CD3 (clone UCHT1, Tonbo Biosciences #40–0038) at a concentration of 10 μg/mL and anti-CD28 (clone CD28.2, Tonbo Biosciences #40–0289) supplemented to the media at a concentration of 5 μg/mL.
RNP nucleofection of CD4+ T cells
Three days after activation (Experiment Day 4), nucleofections were performed using 1e6 CD4+ T cells per nucleofection as previously descibed16. For nucleofections with NTC RNPs, cells were resuspended in 20 μL of P3 Primary Cell Nucleofector solution (Lonza #V4SP-3096) and mixed gently with 4 μL of NTC complexes. For RNPs with Synthego guides, cells were gently resuspended with 25 μL of RNPs. Nucleofections were carried out in a 16-well Nucleocuvette (Lonza #V4SP-3096) using an Amaxa Nucleofector (Lonza) and pulse code EH-115. Cells were allowed to recover for 30 min to 2 h at 37°C and were then brought to 2.5e6 cells/mL in RPMI complete media with 100 U/mL IL-2 and at a 1:1 ratio with activation beads (Miltenyi Biotec #130–091-441). Two days later, 200 μL of RPMI complete media with 100 U/mL IL-2 was added to each nucleofection. At four days post nucleofection, half of the culture media was replaced with fresh RPMI complete media with 100 U/mL IL-2 and cells were brought to 1e6 cells/mL. Starting the following day, cells were counted and resuspended to 1e6 cells/mL in RPMI complete media with 100 U/mL IL-2 every other day.
HIV-1 infection of CD4+ T cells
Ten days post-nucleofection (Experiment Day 14), HIV-1 infections (multiplicity of infection (MOI) of 0.02, 1, or 2, as noted in figure legends) were established via spinoculation at 1100xg for 90 min at 30°C in the presence of 8 μg/mL polybrene (Millipore Sigma #TR-1003-G) as previously described16. After spinoculation, infection inoculum was replaced with fresh RPMI complete with 100 U/mL IL-2. Viral supernatants and cell pellets were harvested at various days post infection as indicated in figure legends.
For infections carried out in the absence of polybrene and spinoculation, cells were infected at an MOI of 1 and were harvested at 3 dpi for HIV-Gag staining, as described below. For pseudovirus infections, cells were infected at an MOI of 1 and harvested at 2 dpi. After collection, pseudovirus-infected cells were fixed in 4% paraformaldehyde (Santa Cruz Biotechnology #sc-281692) for 10 min and were analyzed by flow cytometry on a BD LSRFortessa X-50 or BD FACSymphony A5. Flow cytometry data was analyzed using FlowJo Software (version 10). The gating strategy is depicted in Supplementary Fig. 1A.
HIV-CRISPR screening
On the day after CD4+ T cell isolation and activation (Experiment Day 2), cells were transduced with HIV-TOP opt mChΔW lentivirus containing the PIKA library by spinoculation in the presence of 8 μg/mL protamine sulfate (Millipore Sigma #P3369). Two days later (Experiment Day 4), Cas9 was delivered to cells by nucleofection with NTC RNPs. Nine days after nucleofection (Experiment Day 13), all library cells were treated with 1000 U/mL IFN-β1a (PBL Assay Science #11410). On the following day, infections with HIV-1 IMCs (MOI=1) were established in technical duplicate. Cells were split 1:2 three days post infection with fresh RPMI complete media with 100 U/mL IL-2 and 1000 U/mL IFN-β. Viral supernatants were harvested 3, 4, and 5 dpi and cells were collected 5 dpi. All viral supernatants were filtered to remove cellular debris (Millipore Sigma #SCGP00525) and stored at 4°C up to four days post collection. Viral supernatants across collection days were combined and concentrated over a sucrose gradient, resuspended in 100 μL PBS, and stored at 4°C. Cells were washed in PBS, pelleted, and stored at −80°C.
Guide sequences were amplified from genomic DNA extracted from cell pellets and viral RNA extracted from concentrated viral pellets and were prepared for Illumina sequencing as previously described16. Pooled libraries were sequenced on an Illumina HiSeq 2500 (Fred Hutch Shared Resources Genomics Shared Resource). Illumina sequencing reads (SRA BioProject ID: PRJNA1111960) were analyzed by MAGeCK-Flute53 to generate guide counts and gene-level enrichment data (Fred Hutch Center for Data Visualization; Supplementary Data 1). Read counts for technical duplicates were pooled prior to gene-level enrichment analysis. For enrichment analysis, genomic DNA reads were considered as the “control” condition and viral RNA-derived counts were considered as “treatment”. NTC guide sequences were iteratively binned to create a number of NTC “genes” (synthetic NTCs, synNTCs) with eight guides per gene to match the number of genes in the PIKA library (1906 synNTCs total; Supplementary Table 1). This approach captures variation across NTC guides when analyzing gene-level data more accurately than aggregating all 200 guides into one NTC gene-level data point. Pearson R correlations between MAGeCK scores from different donors were determined using the stat_cor function in the ggpubr package. Screen background was calculated as the average synNTC MAGeCK score + 3 standard deviations.
SLC35A2 rescue experiments
Primary CD4+ T cells were transduced with TOP-SLC35A2 lentivirus on the day after cells were initially thawed and activated (experiment day 2). Transductions were performed via spinoculation at 1100xg for 90 min at 30°C in the presence of 8 μg/mL protamine sulfate (Millipore Sigma #P3369). Cells were nucleofected with SLC35A2 RNPs two days later (experiment day 4), following the normal timeline of all other gene editing and HIV-1 infection experiments. Importantly, SLC35A2 RNPs are unable to target and edit the exogenous codon-optimized SLC35A2 cDNA delivered via transduction with TOP-SLC35A2 lentivirus.
Reverse transcriptase (RT) activity qPCR assay
HIV-1 infection levels were assessed by measuring RT activity (mU/mL) in viral supernatants using the previously described RT activity qPCR assay16,54. The RT units of a concentrated stock of HIV-1 Q23.BG505 virus were determined multiple times using a standard curve of purified HIV-1 RT enzyme (Worthington Biochemical Corp. #LS05003). Aliquots of this titered stock of Q23.BG505 were used as the quantitative standard curve in all assays. The RT activity (mU/mL) of experimental wells was interpolated from the quantitative standard curve using the lm function in the R stats package.
HIV-Gag staining
For high MOI infections (MOI=1), cells were collected for HIV-Gag staining 3 dpi (Fig. 2C, 2D, 3G; Extended Data Fig. 1B). For low MOI infections (MOI=0.02), infections were allowed to proceed for 6 days before harvesting due to the slower nature of viral infection and spread (Extended Data Fig. 2A). HIV-Gag staining is less optimal for evaluating low MOI infections due to reduced signal and therefore serves as a secondary read out for this experiment, supporting measurements of RT activity (Fig. 2E).
After collection, cells were fixed in 4% paraformaldehyde (Santa Cruz Biotechnology #sc-281692) for 10 min and either stored at 4°C for up to two days or immediately prepared for staining. Cell pellets were permeabilized for intracellular staining via resuspension in 0.5% Triton X-100 in PBS for 10 min and were subsequently resuspended in a 1:500 dilution of anti-p24-FITC KC57 antibody (Beckman Coulter #6604665) in 1% BSA in PBS for 1 h at room temperature in the dark. Washed cells were analyzed by flow cytometry on a BD LSRFortessa X-50 or BD FACSymphony A5. Flow cytometry data was analyzed using FlowJo Software (version 10). The gating strategy is depicted in Supplementary Fig. 1B.
Genomic editing analysis
SLC35A2-KO CD4+ T cells were collected on the day of HIV-1 infection to assess for genomic editing as previously described in detail16. In brief, regions containing SLC35A2 guide cut sites were amplified from genomic DNA (forward primer: 5’ AAGCTGCCCACAAATAGCCT; reverse primer: 5’ ATTGGACAGCAGGGTGGATG) and sequenced (sequencing primer: 5’ GGGAGGTTGAAGGAGTTCCA) by Sanger sequencing (Fred Hutch Shared Resources Genomics Core). Chromatograms were analyzed by ICE analysis tool v3 (Synthego) to determine the rate of editing predicted to cause SLC35A2 KO.
Lectin staining
On the day of HIV-1 infection, 2e5 edited CD4+ T cells per stain replicate were collected, fixed in 4% paraformaldehyde for 10 min, and resuspended in 20 μg/mL VVL-FITC (Vector Laboratories #FL-1231–2) and 10 μg/mL GSL-II-AF647 (ThermoFisher #L32451) in 2% FBS in PBS (FACS buffer) for 1 h at room temperature in the dark. Cells were washed, resuspended in FACS buffer, and were analyzed by flow cytometry on a BD LSRFortessa X-50 or BD FACSymphony A5. Flow cytometry data was analyzed using FlowJo Software (version 10). The gating strategy is depicted in Supplementary Fig. 2.
Measuring relative viral infectivity
Viral supernatants were collected from HIV-1 spreading infections (MOI=0.02) six days after infection. Supernatants were assessed for RT activity, as described above, and were titered on TZM-bl cells to determine viral infectivity, as previously described16. Relative viral infectivity (infectious particles (IP) per mU RT) was calculated by dividing viral titer (IP/μL) by RT activity (mU RT/μL).
qPCR assay to quantify reverse transcription intermediates
Reverse transcription intermediates were measured according to a published protocol55, with minor modifications. Prior to infection, LAI virus inoculum was treated with TURBO DNase (ThermoFisher #AM2238) for 30 min at 37°C. In parallel, an aliquot of this virus preparation was heat-inactivated via incubation at 65°C for 30 min. Edited primary CD4+ T cells from three unique donors were then infected at an MOI of 2 in technical triplicate with 150,000 cells per well using the spinoculation and polybrene conditions described above. Cells were harvested 18 hours after infection, washed in PBS, pelleted, and stored at −80°C. Total DNA was isolated from cells from each well using the QIAGEN QIAamp DNA Blood Mini Kit (Qiagen #51104) and eluted in 50 μL AE buffer.
Viral RT intermediates were then assessed using real-time PCR55,56. Primers and probes to analyze early (“RU5”) and late reverse transcription (LRT, “U5ψ”) products were based on those previously described55, with the only modification being a 2 nucleotide deletion (del2) at the end of the MH532 primer due to differences in the LAI sequence at this site: hRU5-P: FAM-AGAGTCACACAACAGACGGGCACACACTA-TAMRA; hRU5-F2: GCCTCAATAAAGCTTGCCTTGA; hRU5-R: TGACTAAAAGGGTCTGAGGGATCT; LRT-P: FAM-CAGTGGCGCCCGAACAGGGA-TAMRA; MH531: TGTGTGCCCGTCTGTTGTGT; MH532del2: GAGTCCTGCGTCGAGAGA. PCR reactions were performed using TaqMan Universal Master Mix II, with UNG (ThermoFisher #4440042) in total volume of 20 μL. In each reaction, 20 nanograms of sample DNA was used as input and the final concentration of primers and probes was 600 nM and 250 nM, respectively. Real-time PCR reactions were run on a ViiA 7 Real-Time PCR system (ThermoFisher). The reaction conditions were as follows: UNG incubation (50°C for 2 min), initial denaturation (95°C for 15 min), 40 cycles of amplification (95°C for 15 sec, 58°C for 30 sec, 72°C for 30 sec). Samples were run in technical replicate and Ct values were averaged. Fold change in RT intermediates between experimental (SLC35A2 KO, heat-inactivated virus) and control (CD19 KO) conditions was calculated using the following equation: .
Surface protein staining
On the day of HIV-1 infection, 2e5 edited CD4+ T cells per stain replicate were collected and resuspended in 20 μL FACS buffer with either 2 μL anti-CD4-APC antibody (clone RPA-T4, BD Biosciences #555349) or 1 μL anti-CXCR4-APC antibody (clone 12G5, BD Biosciences #555976) and 2.5 μL anti-CCR5-PE antibody (clone 2D7, BD Biosciences #555993). Cell-antibody mixtures were incubated for 1 h at room temperature in the dark. Cells were then resuspended in 1% paraformaldehyde in FACS buffer and were analyzed by flow cytometry on a BD LSRFortessa X-50 or BD FACSymphony A5. Flow cytometry data was analyzed using FlowJo Software (version 10). The gating strategies for CD4 and coreceptor expression are depicted in Supplementary Fig. 3A and 3B, respectively.
Analysis of IFN-inducibility
We previously reported a bulk RNA-seq dataset of primary CD4+ T cells treated with IFN-β1a (SRA: PRJNA921704)16. Here, we analyzed this dataset to determine the fold induction of a subset of genes at various times post IFN-β treatment. Fold inductions were averaged across three unique donors for each timepoint.
Analysis of gene expression at HIV-1 transmission sites
To determine expression levels of SLC35A2 and the HIV-1 coreceptors at different anatomical compartments, we analyzed a previously published bulk RNA-seq dataset that assessed CD4+ T cell populations isolated from the blood, endocervix, ectocervix, and vaginal tract of four individuals32. Specifically, this study gated on Live, CD45+CD3+CD4+CCR7- cells to isolate CD4+ T cells and further separated cells into CD103-CD69-, CD103-CD69+, and CD103+CD69+ populations before performing RNA-seq, as CD103 and CD69 are markers of resident memory T cells. We accessed raw counts from this dataset via GEO (GSE163260) and calculated counts per million (CPM) using the cpm function in the Bioconductor edgeR package57. CPMs were averaged across CD4+ T cell populations within a tissue site for each donor to determine gene expression levels in bulk CD4+ T cells at each site.
Analysis of HIV-1 Env glycosylation
Env protein sequences for the X4 and R5 viruses used in Fig. 2E were obtained via http://www.hiv.lanl.gov/ in October 2023. Putative N-glycan sites were considered sites with asparagine-X-serine/threonine, where X is any amino acid except proline.
Experimental design and statistical analysis
The number of technical and biological replicates for each experiment are described in the figure legends. No statistical methods were used to pre-determine sample sizes, but our sample sizes (n=2–5 unique donors per experiment) are similar to those reported in previous publications of genomic editing of primary T cells58–61. Primary cells from individual donors were always used for both experimental (SLC35A2 KO) and control (CD19 KO) conditions. Therefore, randomization was not relevant to this study. Data collection and analysis were not performed blind to the conditions of the experiments. No data points were excluded from analysis.
Prior to applying statistical tests, datasets were evaluated by Shapiro-Wilk tests to assess whether they were normally distributed. For normally distributed data with at least three donor replicates (Fig. 2B, 2C, 3E, 4B, lower panel of Fig. 4C), paired dot plots and two-tailed paired t-tests were used to evaluate comparisons between CD19-KO and SLC35A2-KO cells, pairing by donor. For normally distributed data with less than three donor replicates (Fig. 4A), bar plots and two-tailed unpaired t-tests were applied to evaluate within-donor differences. For data with at least three donor replicates that was not normally distributed (upper panel of Fig. 4C), paired dot plots and a Wilcoxon matched-pairs signed rank test was applied to analyze differences between CD19-KO and SLC35A2-KO cells. Prism 10 was utilized for statistical analyses.
Extended Data
Extended Data Fig. 1. SLC35A2 KO has opposite effects on two HIV-1 strains that utilize different coreceptors, related to Figures 2b, 2c, and 3e.

a. Independent experimental replicates for data depicted in Fig. 2b. Reverse transcriptase (RT) activity, relative (rel) to CD19 KO for each independent primary CD4+ T cell experiment, at 2 dpi (MOI=0.02). Knockouts were performed in five donors across independent knockout and infection experiments as indicated. b. Independent experimental replicates for data depicted in Fig. 2c. Percentage of CD4+ T cells staining positive for HIV-Gag at 3 dpi (MOI=1). Donor letters correspond with those in Panel A. c. Independent experimental replicates for data depicted in Fig. 3e. Percentage of GFP+ CD4+ T cells, relative to CD19 KO, after 2 days of infection with GFP-expressing HIV-1 pseudoviruses (MOI=1). Infection data from all panels are shown as the mean of 2–3 technical replicates, as indicated by individual data points.
Extended Data Fig. 2. SLC35A2 KO differentially impacts CXCR4-tropic and CCR5-tropic HIV-1, related to Figure 2e.

a. Percentage of CD4+ T cells staining positive for HIV-Gag, relative (rel) to CD19 KO, at 6 dpi (MOI=0.02, same infections as depicted in Fig. 2e, different measurement of HIV-1 infection). b. RT activity over time from spreading infections (MOI=0.02) in primary CD4+ T cells from two donors to determine coreceptor tropism. Results are separated by expected coreceptor tropism. Donor numbering is consistent within this figure and with Fig. 2e. Additional information on the strains used for infections is presented in Extended Data Table 1.
Extended Data Fig. 3. Expression of SLC35A2 and the HIV-1 coreceptors in CD4+ T cells from the blood and common HIV-1 transmission sites.

RNA expression levels for (a) SLC35A2, (b) CXCR4, and (c) CCR5 in CD4+ T cells isolated from different anatomical compartments from four donors. Shapes denote donors.
Extended Data Table 1.
Characteristics of the HIV-1 strains used for infections
| HIV-1 Strain | Tropism | Clade | Primary |
|---|---|---|---|
|
| |||
| LAI | X4 | B | No |
| NL4–3 | X4 | B | No |
| 92UG021 | X4 | D | Yes |
| 92UG029 | X4 | A | Yes |
| 92UG024 | X4 | D | Yes |
|
| |||
| Q23.BG505 | R5 | A | Yes |
| Q23 | R5 | A | Yes |
| SF162 | R5 | B | Yes |
| BaL | R5 | B | No |
| 93MW965 | R5 | C | Yes |
|
| |||
| 93BR020 | “X4/R5” | F1 | Yes |
| 89.6 | “X4/R5” | B | Yes |
Supplementary Material
Supplementary Fig. 1. Gating strategies for flow cytometry data to measure HIV-1 infection. Gating strategies to measure (a) GFP-expressing pseudovirus infection and (b) HIV-1 infection using HIV-Gag staining.
Supplementary Fig. 2. Gating strategies for flow cytometry data to measure lectin staining.
Supplementary Fig. 3. Gating strategies for flow cytometry data to measure cell surface marker expression. Gating strategies to measure (a) CD4 and (b) CCR5 and CXCR4 expression.
ACKNOWLEDGMENTS
We thank the Fred Hutch Shared Resources Genomics and Bioinformatics Cores, particularly Alyssa Dawson and Elizabeth Jensen for performing Illumina and Sanger sequencing, respectively; the Fred Hutch Center for Data Visualization, especially Michael Zager, Nathan Thorpe, and Sam Minot, for their support with MAGeCK analysis; Michael Emerman, Molly Ohainle, Caitlin Stoddard, and Alex Willcox for helpful discussions and technical assistance. We also thank Michael Emerman (Division of Human Biology, Fred Hutchinson Cancer Center, Seattle, WA, USA) for sharing LAI and VSV-G envelope plasmids with us. Figures 1A, 3A, and 5 were generated with BioRender. This work was supported by the following NIH grants: NICHD R01 HD103571 to J.O. and NIGMS T32 GM007270 and NIAID F31 AI165168 to H.L.I. The funders had no role in study design, data collection and analysis, decision to publish, or preparation of the manuscript.
Footnotes
COMPETING INTERESTS
The authors declare no competing interests.
DATA AVAILABILITY
Illumina sequencing reads from HIV-CRISPR screens can be accessed via the NCBI Sequence Read Archive (SRA BioProject ID: PRJNA1111960). Data for all figures are provided as Source Data.
REFERENCES
- 1.Ronen K, Sharma A & Overbaugh J HIV transmission biology: translation for HIV prevention. AIDS 29, 2219–2227, doi: 10.1097/QAD.0000000000000845 (2015). [DOI] [PMC free article] [PubMed] [Google Scholar]
- 2.Wolinsky SM et al. Selective transmission of human immunodeficiency virus type-1 variants from mothers to infants. Science 255, 1134–1137, doi: 10.1126/science.1546316 (1992). [DOI] [PubMed] [Google Scholar]
- 3.Wolfs TF, Zwart G, Bakker M & Goudsmit J HIV-1 genomic RNA diversification following sexual and parenteral virus transmission. Virology 189, 103–110, doi: 10.1016/0042-6822(92)90685-i (1992). [DOI] [PubMed] [Google Scholar]
- 4.Zhu T et al. Genotypic and phenotypic characterization of HIV-1 patients with primary infection. Science 261, 1179–1181, doi: 10.1126/science.8356453 (1993). [DOI] [PubMed] [Google Scholar]
- 5.Zhang LQ et al. Selection for specific sequences in the external envelope protein of human immunodeficiency virus type 1 upon primary infection. J Virol 67, 3345–3356, doi: 10.1128/JVI.67.6.3345-3356.1993 (1993). [DOI] [PMC free article] [PubMed] [Google Scholar]
- 6.Keele BF et al. Identification and characterization of transmitted and early founder virus envelopes in primary HIV-1 infection. Proc Natl Acad Sci U S A 105, 7552–7557, doi: 10.1073/pnas.0802203105 (2008). [DOI] [PMC free article] [PubMed] [Google Scholar]
- 7.Shaw GM & Hunter E HIV transmission. Cold Spring Harb Perspect Med 2, doi: 10.1101/cshperspect.a006965 (2012). [DOI] [PMC free article] [PubMed] [Google Scholar]
- 8.Carlson JM et al. HIV transmission. Selection bias at the heterosexual HIV-1 transmission bottleneck. Science 345, 1254031, doi: 10.1126/science.1254031 (2014). [DOI] [PMC free article] [PubMed] [Google Scholar]
- 9.Sugrue E et al. The apparent interferon resistance of transmitted HIV-1 is possibly a consequence of enhanced replicative fitness. PLoS Pathog 18, e1010973, doi: 10.1371/journal.ppat.1010973 (2022). [DOI] [PMC free article] [PubMed] [Google Scholar]
- 10.Fenton-May AE et al. Relative resistance of HIV-1 founder viruses to control by interferon-alpha. Retrovirology 10, 146, doi: 10.1186/1742-4690-10-146 (2013). [DOI] [PMC free article] [PubMed] [Google Scholar]
- 11.Parrish NF et al. Phenotypic properties of transmitted founder HIV-1. Proc Natl Acad Sci U S A 110, 6626–6633, doi: 10.1073/pnas.1304288110 (2013). [DOI] [PMC free article] [PubMed] [Google Scholar]
- 12.Wilen CB, Tilton JC & Doms RW HIV: cell binding and entry. Cold Spring Harb Perspect Med 2, doi: 10.1101/cshperspect.a006866 (2012). [DOI] [PMC free article] [PubMed] [Google Scholar]
- 13.Long EM, Rainwater SM, Lavreys L, Mandaliya K & Overbaugh J HIV type 1 variants transmitted to women in Kenya require the CCR5 coreceptor for entry, regardless of the genetic complexity of the infecting virus. AIDS Res Hum Retroviruses 18, 567–576, doi: 10.1089/088922202753747914 (2002). [DOI] [PubMed] [Google Scholar]
- 14.Saba E et al. HIV-1 sexual transmission: early events of HIV-1 infection of human cervico-vaginal tissue in an optimized ex vivo model. Mucosal Immunol 3, 280–290, doi: 10.1038/mi.2010.2 (2010). [DOI] [PMC free article] [PubMed] [Google Scholar]
- 15.Shepherd JC et al. Emergence and persistence of CXCR4-tropic HIV-1 in a population of men from the multicenter AIDS cohort study. J Infect Dis 198, 1104–1112, doi: 10.1086/591623 (2008). [DOI] [PMC free article] [PubMed] [Google Scholar]
- 16.Itell HL, Humes D & Overbaugh J Several cell-intrinsic effectors drive type I interferon-mediated restriction of HIV-1 in primary CD4(+) T cells. Cell Rep 42, 112556, doi: 10.1016/j.celrep.2023.112556 (2023). [DOI] [PMC free article] [PubMed] [Google Scholar]
- 17.Colomer-Lluch M, Ruiz A, Moris A & Prado JG Restriction Factors: From Intrinsic Viral Restriction to Shaping Cellular Immunity Against HIV-1. Front Immunol 9, 2876, doi: 10.3389/fimmu.2018.02876 (2018). [DOI] [PMC free article] [PubMed] [Google Scholar]
- 18.Doyle T, Goujon C & Malim MH HIV-1 and interferons: who’s interfering with whom? Nat Rev Microbiol 13, 403–413, doi: 10.1038/nrmicro3449 (2015). [DOI] [PMC free article] [PubMed] [Google Scholar]
- 19.Malim MH & Bieniasz PD HIV Restriction Factors and Mechanisms of Evasion. Cold Spring Harb Perspect Med 2, a006940, doi: 10.1101/cshperspect.a006940 (2012). [DOI] [PMC free article] [PubMed] [Google Scholar]
- 20.Altfeld M & Gale M Jr. Innate immunity against HIV-1 infection. Nat Immunol 16, 554–562, doi: 10.1038/ni.3157 (2015). [DOI] [PubMed] [Google Scholar]
- 21.Gelinas JF, Gill DR & Hyde SC Multiple Inhibitory Factors Act in the Late Phase of HIV-1 Replication: a Systematic Review of the Literature. Microbiol Mol Biol Rev 82, doi: 10.1128/MMBR.00051-17 (2018). [DOI] [PMC free article] [PubMed] [Google Scholar]
- 22.Peden K, Emerman M & Montagnier L Changes in growth properties on passage in tissue culture of viruses derived from infectious molecular clones of HIV-1LAI, HIV-1MAL, and HIV-1ELI. Virology 185, 661–672, doi: 10.1016/0042-6822(91)90537-l (1991). [DOI] [PubMed] [Google Scholar]
- 23.Haddox HK, Dingens AS, Hilton SK, Overbaugh J & Bloom JD Mapping mutational effects along the evolutionary landscape of HIV envelope. Elife 7, doi: 10.7554/eLife.34420 (2018). [DOI] [PMC free article] [PubMed] [Google Scholar]
- 24.OhAinle M et al. A virus-packageable CRISPR screen identifies host factors mediating interferon inhibition of HIV. Elife 7, doi: 10.7554/eLife.39823 (2018). [DOI] [PMC free article] [PubMed] [Google Scholar]
- 25.S PH, Krumbiegel M & Kirchhoff F. Coreceptor usage of BOB/GPR15 and Bonzo/STRL33 by primary isolates of human immunodeficiency virus type 1. J Gen Virol 80 ( Pt 5), 1241–1251, doi: 10.1099/0022-1317-80-5-1241 (1999). [DOI] [PubMed] [Google Scholar]
- 26.Doranz BJ et al. A dual-tropic primary HIV-1 isolate that uses fusin and the beta-chemokine receptors CKR-5, CKR-3, and CKR-2b as fusion cofactors. Cell 85, 1149–1158, doi: 10.1016/s0092-8674(00)81314-8 (1996). [DOI] [PubMed] [Google Scholar]
- 27.Quelhas D et al. SLC35A2-CDG: Novel variant and review. Mol Genet Metab Rep 26, 100717, doi: 10.1016/j.ymgmr.2021.100717 (2021). [DOI] [PMC free article] [PubMed] [Google Scholar]
- 28.in Essentials of Glycobiology (eds Varki A et al. ) (2022). [Google Scholar]
- 29.Ng BG et al. SLC35A2-CDG: Functional characterization, expanded molecular, clinical, and biochemical phenotypes of 30 unreported Individuals. Hum Mutat 40, 908–925, doi: 10.1002/humu.23731 (2019). [DOI] [PMC free article] [PubMed] [Google Scholar]
- 30.Bojar D et al. A Useful Guide to Lectin Binding: Machine-Learning Directed Annotation of 57 Unique Lectin Specificities. ACS Chem Biol 17, 2993–3012, doi: 10.1021/acschembio.1c00689 (2022). [DOI] [PMC free article] [PubMed] [Google Scholar]
- 31.O’Doherty U, Swiggard WJ & Malim MH Human immunodeficiency virus type 1 spinoculation enhances infection through virus binding. J Virol 74, 10074–10080, doi: 10.1128/jvi.74.21.10074-10080.2000 (2000). [DOI] [PMC free article] [PubMed] [Google Scholar]
- 32.Woodward Davis AS et al. The human memory T cell compartment changes across tissues of the female reproductive tract. Mucosal Immunol 14, 862–872, doi: 10.1038/s41385-021-00406-6 (2021). [DOI] [PMC free article] [PubMed] [Google Scholar]
- 33.Uhlen M et al. Proteomics. Tissue-based map of the human proteome. Science 347, 1260419, doi: 10.1126/science.1260419 (2015). [DOI] [PubMed] [Google Scholar]
- 34.Ma T et al. Single-cell glycomics analysis by CyTOF-Lec reveals glycan features defining cells differentially susceptible to HIV. Elife 11, doi: 10.7554/eLife.78870 (2022). [DOI] [PMC free article] [PubMed] [Google Scholar]
- 35.Chabot DJ, Chen H, Dimitrov DS & Broder CC N-linked glycosylation of CXCR4 masks coreceptor function for CCR5-dependent human immunodeficiency virus type 1 isolates. J Virol 74, 4404–4413, doi: 10.1128/jvi.74.9.4404-4413.2000 (2000). [DOI] [PMC free article] [PubMed] [Google Scholar]
- 36.Bannert N et al. Sialylated O-glycans and sulfated tyrosines in the NH2-terminal domain of CC chemokine receptor 5 contribute to high affinity binding of chemokines. J Exp Med 194, 1661–1673, doi: 10.1084/jem.194.11.1661 (2001). [DOI] [PMC free article] [PubMed] [Google Scholar]
- 37.Farzan M et al. Tyrosine sulfation of the amino terminus of CCR5 facilitates HIV-1 entry. Cell 96, 667–676, doi: 10.1016/s0092-8674(00)80577-2 (1999). [DOI] [PubMed] [Google Scholar]
- 38.Lee B et al. Epitope mapping of CCR5 reveals multiple conformational states and distinct but overlapping structures involved in chemokine and coreceptor function. J Biol Chem 274, 9617–9626, doi: 10.1074/jbc.274.14.9617 (1999). [DOI] [PubMed] [Google Scholar]
- 39.Spillings BL et al. Host glycocalyx captures HIV proximal to the cell surface via oligomannose-GlcNAc glycan-glycan interactions to support viral entry. Cell Rep 38, 110296, doi: 10.1016/j.celrep.2022.110296 (2022). [DOI] [PubMed] [Google Scholar]
- 40.Mereiter S, Balmana M, Campos D, Gomes J & Reis CA Glycosylation in the Era of Cancer-Targeted Therapy: Where Are We Heading? Cancer Cell 36, 6–16, doi: 10.1016/j.ccell.2019.06.006 (2019). [DOI] [PubMed] [Google Scholar]
- 41.Ju T & Cummings RD A unique molecular chaperone Cosmc required for activity of the mammalian core 1 beta 3-galactosyltransferase. Proc Natl Acad Sci U S A 99, 16613–16618, doi: 10.1073/pnas.262438199 (2002). [DOI] [PMC free article] [PubMed] [Google Scholar]
- 42.Matia A et al. Identification of beta2 microglobulin, the product of B2M gene, as a Host Factor for Vaccinia Virus Infection by Genome-Wide CRISPR genetic screens. PLoS Pathog 18, e1010800, doi: 10.1371/journal.ppat.1010800 (2022). [DOI] [PMC free article] [PubMed] [Google Scholar]
- 43.Sun Q et al. Synaptogyrin-2 Promotes Replication of a Novel Tick-borne Bunyavirus through Interacting with Viral Nonstructural Protein NSs. J Biol Chem 291, 16138–16149, doi: 10.1074/jbc.M116.715599 (2016). [DOI] [PMC free article] [PubMed] [Google Scholar]
- 44.Pickering S et al. Preservation of tetherin and CD4 counter-activities in circulating Vpu alleles despite extensive sequence variation within HIV-1 infected individuals. PLoS Pathog 10, e1003895, doi: 10.1371/journal.ppat.1003895 (2014). [DOI] [PMC free article] [PubMed] [Google Scholar]
- 45.Poss M & Overbaugh J Variants from the diverse virus population identified at seroconversion of a clade A human immunodeficiency virus type 1-infected woman have distinct biological properties. J Virol 73, 5255–5264, doi: 10.1128/JVI.73.7.5255-5264.1999 (1999). [DOI] [PMC free article] [PubMed] [Google Scholar]
- 46.Wu X et al. Neutralization escape variants of human immunodeficiency virus type 1 are transmitted from mother to infant. J Virol 80, 835–844, doi: 10.1128/JVI.80.2.835-844.2006 (2006). [DOI] [PMC free article] [PubMed] [Google Scholar]
- 47.Cheng-Mayer C, Quiroga M, Tung JW, Dina D & Levy JA Viral determinants of human immunodeficiency virus type 1 T-cell or macrophage tropism, cytopathogenicity, and CD4 antigen modulation. J Virol 64, 4390–4398, doi: 10.1128/JVI.64.9.4390-4398.1990 (1990). [DOI] [PMC free article] [PubMed] [Google Scholar]
- 48.Adachi A et al. Production of acquired immunodeficiency syndrome-associated retrovirus in human and nonhuman cells transfected with an infectious molecular clone. J Virol 59, 284–291, doi: 10.1128/JVI.59.2.284-291.1986 (1986). [DOI] [PMC free article] [PubMed] [Google Scholar]
- 49.Gartner S et al. The role of mononuclear phagocytes in HTLV-III/LAV infection. Science 233, 215–219, doi: 10.1126/science.3014648 (1986). [DOI] [PubMed] [Google Scholar]
- 50.Collman R et al. An infectious molecular clone of an unusual macrophage-tropic and highly cytopathic strain of human immunodeficiency virus type 1. J Virol 66, 7517–7521, doi: 10.1128/JVI.66.12.7517-7521.1992 (1992). [DOI] [PMC free article] [PubMed] [Google Scholar]
- 51.Provine NM, Cortez V, Chohan V & Overbaugh J The neutralization sensitivity of viruses representing human immunodeficiency virus type 1 variants of diverse subtypes from early in infection is dependent on producer cell, as well as characteristics of the specific antibody and envelope variant. Virology 427, 25–33, doi: 10.1016/j.virol.2012.02.001 (2012). [DOI] [PMC free article] [PubMed] [Google Scholar]
- 52.Humes D, Rainwater S & Overbaugh J The TOP vector: a new high-titer lentiviral construct for delivery of sgRNAs and transgenes to primary T cells. Mol Ther Methods Clin Dev 20, 30–38, doi: 10.1016/j.omtm.2020.10.020 (2021). [DOI] [PMC free article] [PubMed] [Google Scholar]
- 53.Wang B et al. Integrative analysis of pooled CRISPR genetic screens using MAGeCKFlute. Nat Protoc 14, 756–780, doi: 10.1038/s41596-018-0113-7 (2019). [DOI] [PMC free article] [PubMed] [Google Scholar]
- 54.Vermeire J et al. Quantification of reverse transcriptase activity by real-time PCR as a fast and accurate method for titration of HIV, lenti- and retroviral vectors. PLoS One 7, e50859, doi: 10.1371/journal.pone.0050859 (2012). [DOI] [PMC free article] [PubMed] [Google Scholar]
- 55.Mbisa JL, Delviks-Frankenberry KA, Thomas JA, Gorelick RJ & Pathak VK Real-time PCR analysis of HIV-1 replication post-entry events. Methods Mol Biol 485, 55–72, doi: 10.1007/978-1-59745-170-3_5 (2009). [DOI] [PMC free article] [PubMed] [Google Scholar]
- 56.Selyutina A, Persaud M, Lee K, KewalRamani V & Diaz-Griffero F Nuclear Import of the HIV-1 Core Precedes Reverse Transcription and Uncoating. Cell Rep 32, 108201, doi: 10.1016/j.celrep.2020.108201 (2020). [DOI] [PMC free article] [PubMed] [Google Scholar]
- 57.Robinson MD, McCarthy DJ & Smyth GK edgeR: a Bioconductor package for differential expression analysis of digital gene expression data. Bioinformatics 26, 139–140, doi: 10.1093/bioinformatics/btp616 (2010). [DOI] [PMC free article] [PubMed] [Google Scholar]
- 58.Hiatt J et al. A functional map of HIV-host interactions in primary human T cells. Nat Commun 13, 1752, doi: 10.1038/s41467-022-29346-w (2022). [DOI] [PMC free article] [PubMed] [Google Scholar]
- 59.Goujon C et al. Human MX2 is an interferon-induced post-entry inhibitor of HIV-1 infection. Nature 502, 559–562, doi: 10.1038/nature12542 (2013). [DOI] [PMC free article] [PubMed] [Google Scholar]
- 60.Bosso M et al. Nuclear PYHIN proteins target the host transcription factor Sp1 thereby restricting HIV-1 in human macrophages and CD4+ T cells. PLoS Pathog 16, e1008752, doi: 10.1371/journal.ppat.1008752 (2020). [DOI] [PMC free article] [PubMed] [Google Scholar]
- 61.Foster TL et al. Resistance of Transmitted Founder HIV-1 to IFITM-Mediated Restriction. Cell Host Microbe 20, 429–442, doi: 10.1016/j.chom.2016.08.006 (2016). [DOI] [PMC free article] [PubMed] [Google Scholar]
Associated Data
This section collects any data citations, data availability statements, or supplementary materials included in this article.
Supplementary Materials
Supplementary Fig. 1. Gating strategies for flow cytometry data to measure HIV-1 infection. Gating strategies to measure (a) GFP-expressing pseudovirus infection and (b) HIV-1 infection using HIV-Gag staining.
Supplementary Fig. 2. Gating strategies for flow cytometry data to measure lectin staining.
Supplementary Fig. 3. Gating strategies for flow cytometry data to measure cell surface marker expression. Gating strategies to measure (a) CD4 and (b) CCR5 and CXCR4 expression.
Data Availability Statement
Illumina sequencing reads from HIV-CRISPR screens can be accessed via the NCBI Sequence Read Archive (SRA BioProject ID: PRJNA1111960). Data for all figures are provided as Source Data.