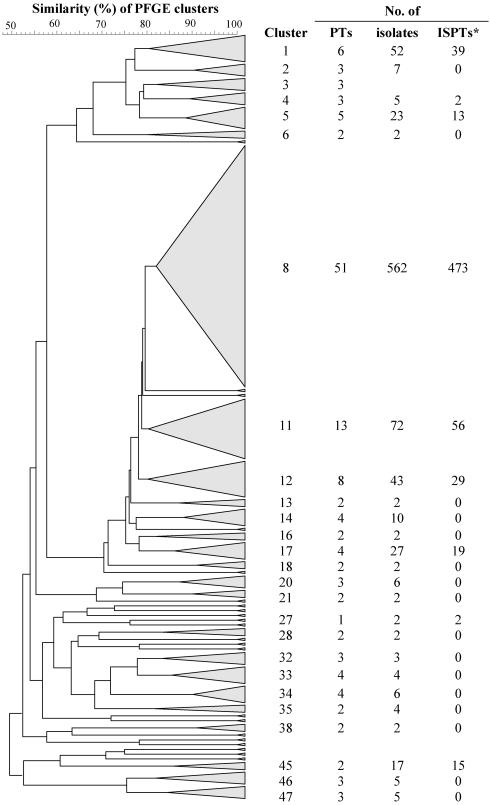
FIG. 1.
Dendrogram generated by cluster analysis using the unweighted-pair group method using average linkages, based on the Dice coefficient. Band position tolerances and optimization were set to 1%. The 47 clusters were obtained from PFGE of SmaI-digested DNAs from 905 ruminant S. aureus mastitis isolates. The cluster cutoff was set at 80% similarity. For each cluster with more than one PT, the number of PTs, the number of isolates, and the number of isolates belonging to PTs found in more than one host species (interspecies PTs, ISPTs*) are presented next to the cluster triangle and cluster designation. The base of each cluster triangle is proportionate to the number of PTs within the cluster.

