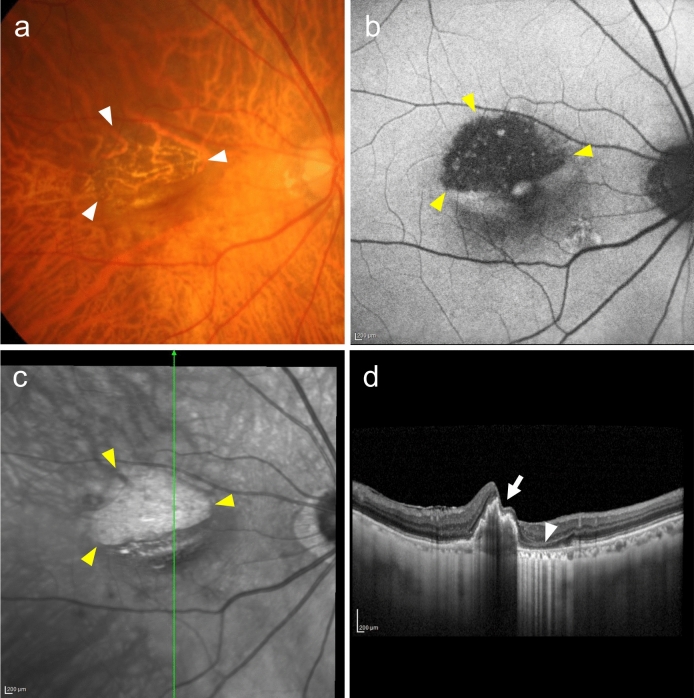
Fig. 11.
Retinal pigment epithelium tear. a Fundus photo shows choroid visible through the RPE defect (arrowhead). b Fundus autofluorescence shows hypofluorescence, indicating the RPE defect (arrowhead). Scale bar, 200 μm. c Near-infrared image shows the RPE tear area as a hyperreflective area (arrowhead). Scale bar, 200 μm. d OCT corresponding to the green arrow in (c) shows RPE shrinkage (rolling, arrow) and RPE defect (arrowhead). Scale bar, 200 μm

